
Fig. 4.
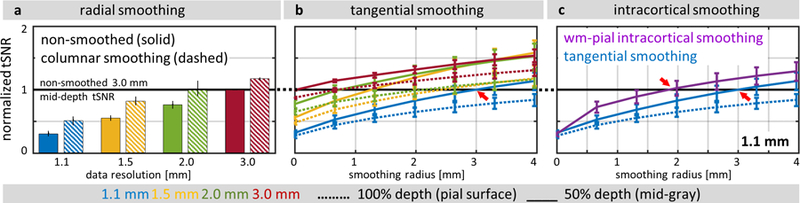
The effect of radial (columnar), tangential (laminar), and intracortical smoothing on tSNR values of resting-state fMRI data. For comparison, tSNR values were normalized to a reference tSNR of non-smoothed 3.0-mm isotropic resolution data sampled at midgray depth (represented by the black horizontal line), then averaged across five subjects. (a) The results of radial smoothing (dashed bars) are compared with the tSNR of the original data (solid bars) for all four spatial resolutions (1.1, 1.5, 2.0 and 3.0 mm isotropic) and averaged across all cortical depths. (b) The results of tangential smoothing plotted as a function of tangential smoothing radius, for all four spatial resolutions; line colors indicate different spatial resolutions (as in panel a). (c) The results of intracortical smoothing across all depths (IC-all: 00– 10, extending from WM to pial surface) plotted as a function of tangential smoothing radius, for 1.1-mm isotropic resolution data only. For comparison, the tSNR plot of tangential smoothing (blue curve) is reproduced from panel b. In (b) and (c), dashed lines represent data at 100% depth (i.e., at the pial surface), and solid lines represent data at 50% depth (i.e., at the midgray surface); see legend below panel. Red arrows indicate transitions where smoothing of 1.1-mm data produces tSNR that exceeds the tSNR level of the reference non-smoothed 3.0-mm data. Error bars indicate standard error across subjects.