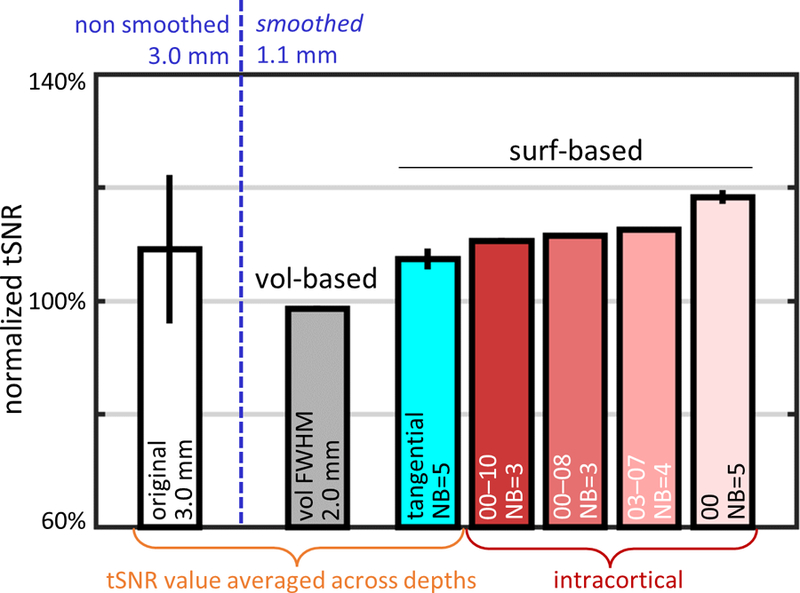
Fig. 5.

tSNR values (averaged across 5 subjects) calculated for 1.1-mm isotropic resting-state fMRI data after smoothing with a set of kernels with equivalent smoothing capacities. For comparison, the resulting tSNR was normalized to the reference tSNR of conventional volume-based smoothed data using a 3D kernel with FWHM=2.0 mm sampled at midgray depth. The reference tSNR of the volume-smoothed data, represented by the gray bar, is compared with the tSNR after applying a set of surface-based smoothing kernels with smoothing capacity matched to the FWHM=2.0 mm volume-smoothing kernel: a purely tangential kernel with NB=5 (radius≈3.3 mm, cyan bar) where the resulting tSNR values were averaged across depths, and with intracortical kernels with varying tangential neighborhoods (red-scale bars) including: one extending across all depths (IC-all: 00–10), one extending from the WM to an intermediate depth (IC-wm: 00–08), one centered at midgray depth and extending symmetrically in both directions (IC-mid: 03–07), and one consisting only of the WM surface (IC-wm: 00). Normalized tSNR of non-smoothed 3.0-mm isotropic data was plotted for comparison (white bar). Error bars indicate standard error across subjects.
