
Fig. 6.
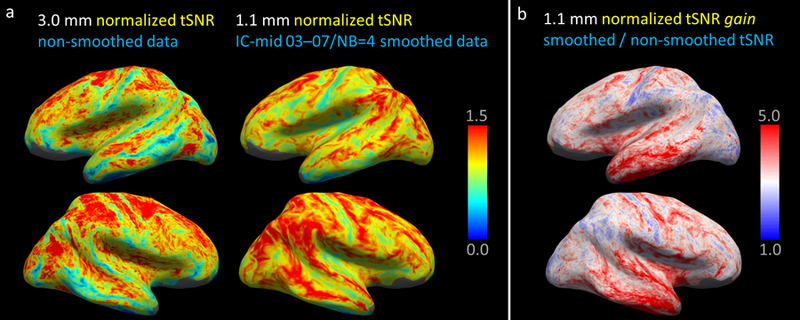
Visualization of the spatial distribution of tSNR averaged across subjects using the FreeSurfer CVS avg35 atlas space, shown on the inflated surface representation. (a) Normalized tSNR of the non-smoothed 3.0-mm isotropic resolution data and the 1.1-mm isotropic resolution data after smoothing with surface-based kernel IC-mid 03–07 NB=4. Regional differences in the tSNR maps are seen, however the tSNR of the smoothed 1.1 mm isotropic data is higher than the unsmoothed 3.0-mm isotropic data in nearly every region of the cortical hemispheres. (b) tSNR gain maps showing the tSNR increase, the ratio of 1.1-mm isotropic resolution data smoothed using the kernel from panel (a) by the same non-smoothed 1.1-mm data. For this example acquisition and this example kernel, some brain regions naturally benefit more from smoothing than others.