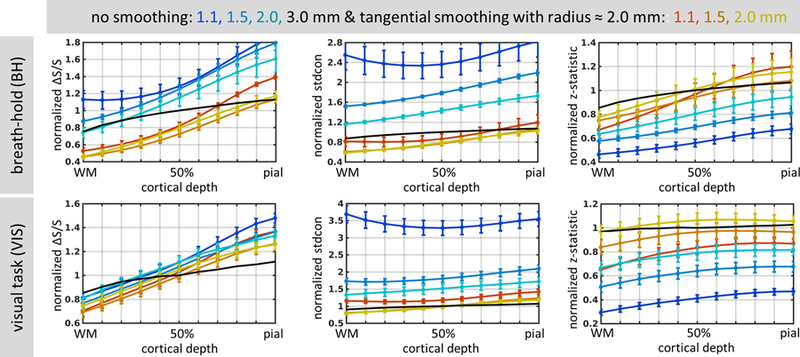
Fig. 7.

Normalized percent signal change (ΔS/S), contrast standard deviation (stdcon), and z-statistic values, averaged across 5 subjects and plotted as a function of cortical depth, for breath-hold (BH, top) and visual task (VIS, bottom), for all spatial resolutions: 1.1, 1.5, 2.0 and 3.0 mm isotropic. Blue-to-cyan lines represent original, non-smoothed data at 1.1, 1.5, and 2.0-mm isotropic resolution, while red-to-yellow lines correspond to data smoothed tangentially with radius of about 2.0 mm (NB=3) at 1.1, 1.5, and 2.0-mm isotropic resolution. Black line represents the values of the non-smoothed 3.0-mm isotropic data for comparison. Error bars indicate standard error across subjects.
