
Fig. 8.
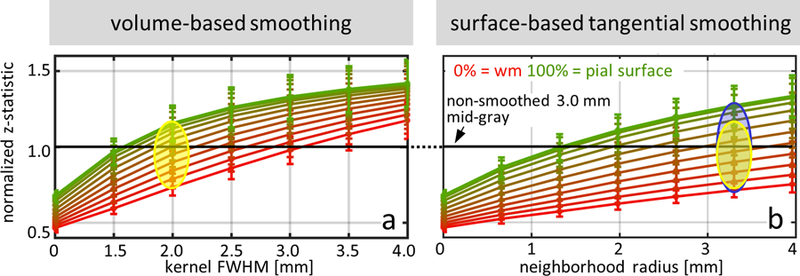
Normalized z-statistic values, averaged across 5 subjects, calculated for 1.1-mm isotropic breath-hold fMRI data, plotted as a function of smoothing kernel size, for all cortical depths (red to green, with red representing data sampled at the WM surface, and green representing data sampled at the pial surface). (a) Conventional 3D volume-based smoothing with various kernel sizes up to 4-mm FWHM. The yellow oval highlights the spread of z-statistic values for a specific kernel size (2-mm FWHM). (b) Proposed 2D tangential surface-based smoothing with radius up to 4 mm. The yellow oval from panel (a) is reproduced here, and is placed at the surface-smoothing radius corresponding to the kernel with smoothing capacity equivalent to the 2.0-mm FWHM 3D volume-smoothing kernel, with the blue oval outlining spread of the z-statistic values across cortical depths (NB=5, radius≈3.3 mm). The blue oval highlights how, at this same smoothing capacity, the surface-based tangential smoothing achieves a broader range of resulting z-statistic values across depths. In both panels the black line represents the reference non-smoothed 3.0-mm isotropic data, and error bars represent standard error across subjects.