Figure 3.

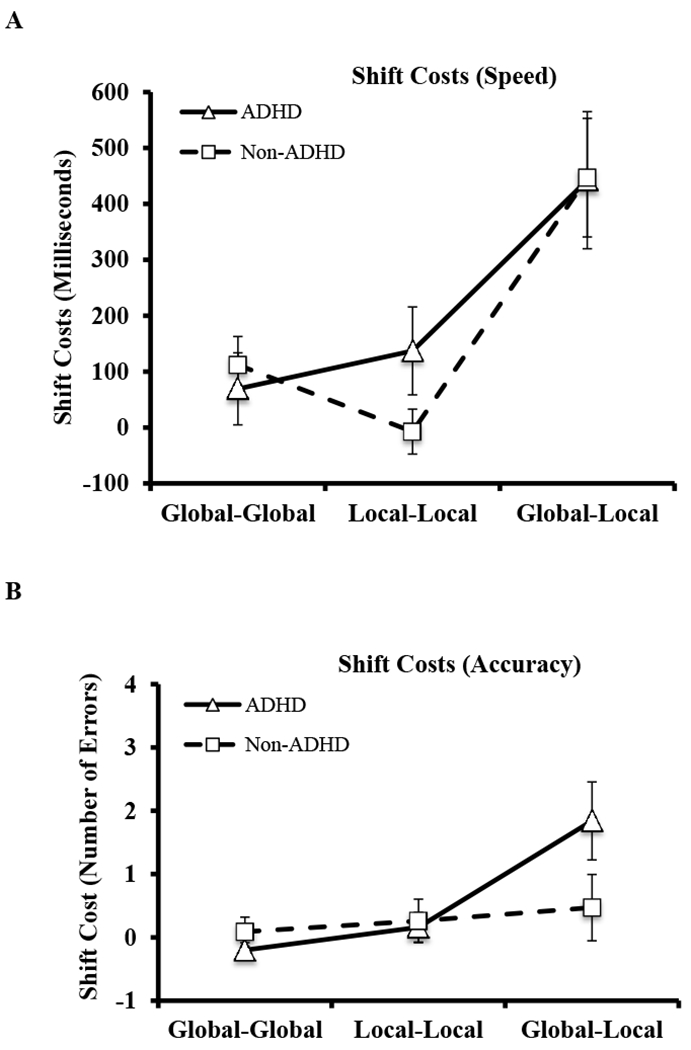
Graphs depicting group mean differences in (A) response times (RTshift – RTno-shift) and (B) errors (Errorsshift – Errorsno-shift) across the three task conditions. Error bars reflect 95% confidence intervals.

Graphs depicting group mean differences in (A) response times (RTshift – RTno-shift) and (B) errors (Errorsshift – Errorsno-shift) across the three task conditions. Error bars reflect 95% confidence intervals.