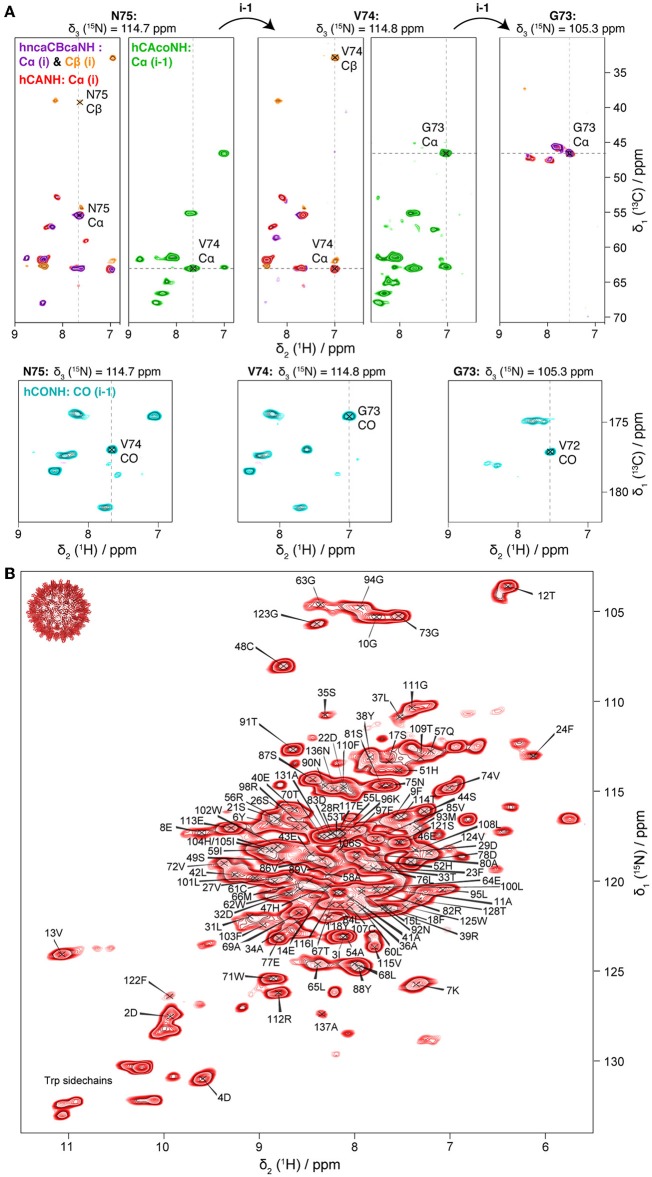
Figure 1.
(A) 3D planes of pCp149 capsids spectra showing a sequential walk for residues N75, V74, and G73. Four spectra were recorded: hncaCBcaNH in purple (positive peaks: Cα) and orange (negative peaks: Cβ); hCANH in red (Cα); hCAcoNH in green (Cα of the preceding residue); and hCONH in cyan (CO of the preceding residue). (B) Assigned hNH spectrum of pCp149 capsids, with resonance frequencies deposited in the BMRB under accession number 27845. The spectrum was processed with QSINE three in both dimensions.

