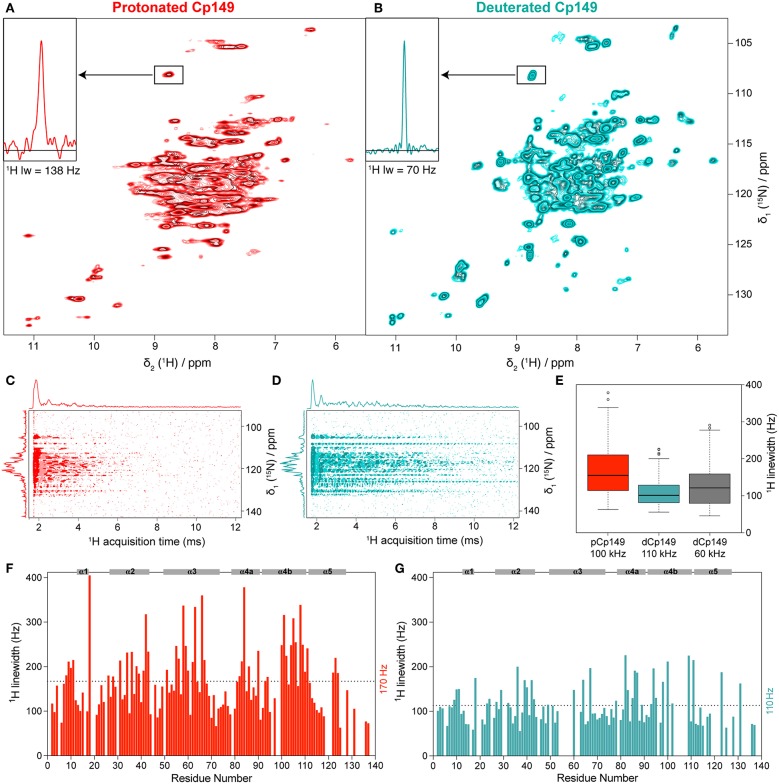
Figure 3.
hNH spectra of (A) pCp149, and (B) dCp149 capsids. The proton line of C48 is shown in the inserts. Both spectra were recorded with identical acquisition parameters (100 kHz MAS, 40 scans, 12 h total experimental time, VTU 273 K, and 25 ms acquisition in the 15N dimension) and processing parameters (with no apodization function, cut at 12.9 ms acquisition in the 1H dimension and zero-filled to 4,096 points and 1,024 points in the 1H and 15N dimensions, respectively). (C,D) FIDs from hNH spectra processed in the time domain using the xf1 command in TopSpin for Cp149 protonated (red) and deuterated capsids (cyan). (E) Dispersion of total proton linewidths measured on all assigned residues in 3D hCANH spectra of pCp149 at 100 kHz (red) and dCp149 capsids at 110 kHz (cyan) and 60 kHz (gray). Median values are indicated as a black line within each box and outliers as circles, defined as exceeding 1.5 times the interquartile range above the third or below the first quartile. (F,G) Total proton linewidths for assigned residues observed in the 3D hCANH spectra of pCp149 (red) and dCp149 capsids (cyan) using parabolic fit in CcpNmr (Vranken et al., 2005). Both 3D spectra were run with a similar experimental time of about 22 h and were processed identically (with no apodization function, cut at 12.9 ms acquisition in 1H dimension and zero-filled to 2,048 points in 1H dimension and 128 points in 13C and 15N dimensions). The average linewidth value for both samples is indicated as dotted lines and secondary structure elements are identified on the top of each graph.

