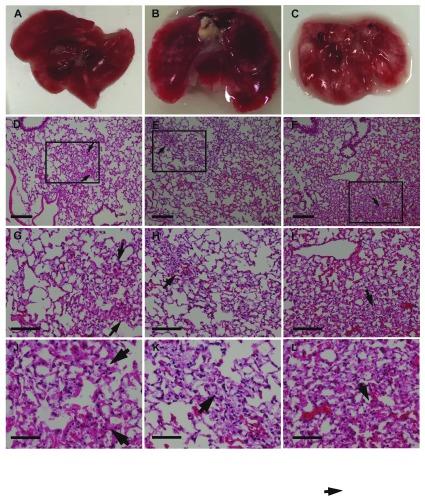
Figure 3. Gross appearance and histology of the lungs of SCID mice injected with H3122 human lung adenocarcinoma cells via the tail vein.
(A-C) lungs from mice injected with cells at 3 (A), 5 (B), and 8 (C) weeks after cell injection. Note the white patches on the lungs, which appeared by week 5; D-F. Haematoxylin and Eosin stain of lungs from mice at 3 (D), 5 (E), and 8 (F) weeks after cell injection using a 10x objective. Squares and arrows indicate areas of high cell density; (G-I) Area shown in insets from panels (D-F) respectively, using a 20x objective. (J-L) Area shown in insets from images (D-F), respectively, using a 40x objective. Scale bars: D-I 100 µm; J-L 50 µm.

