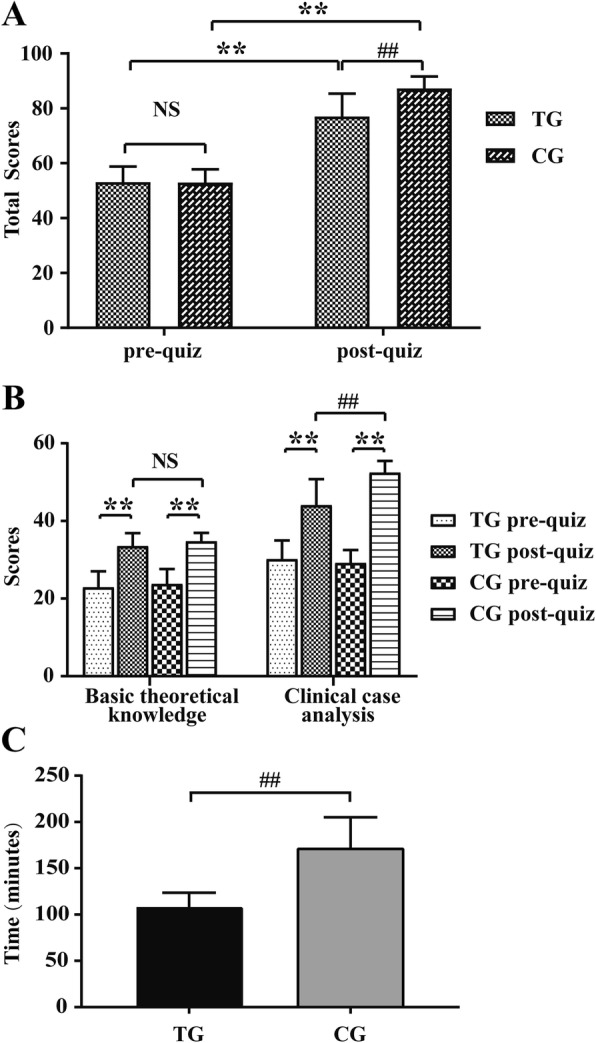
Fig. 2.

Mean scores of pre- and post-quiz in TG (N = 37) and CG (N = 37). (a). Comparison of mean pre- and post-quiz total score between TG and CG. (b). Comparison of mean pre- and post-quiz score on basic theoretical knowledge and clinical case analysis between TG and CG, respectively. TG: traditional lecture-based classroom group, CG: combination group of flipped classroom with problem-based learning. Data are presented as the means ± standard deviation (SD); ** p < 0.001 post-quiz vs. pre-quiz, ## p < 0.001 CG vs. TG, and NS: no significant difference
