Fig. 1.

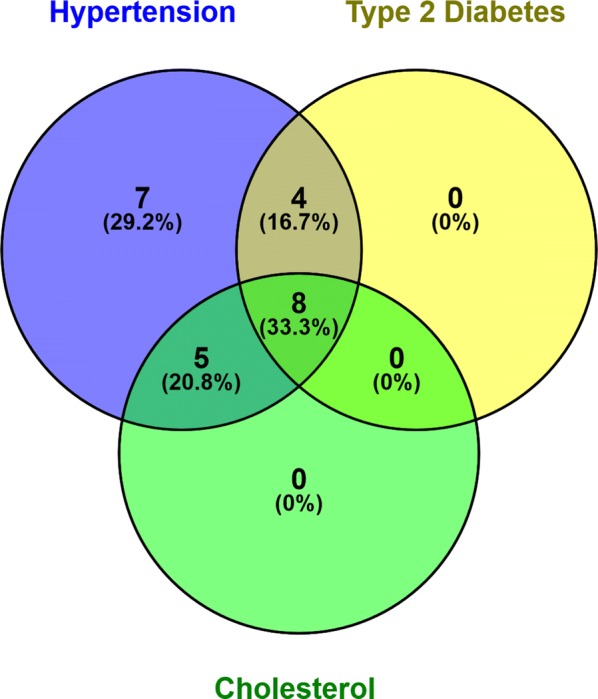
Participant Cardiovascular Burden. This figure illustrates the number and percentage of subjects in the present sample with one or more cardiovascular conditions (hypertension, type 2 diabetes, and high cholesterol)

Participant Cardiovascular Burden. This figure illustrates the number and percentage of subjects in the present sample with one or more cardiovascular conditions (hypertension, type 2 diabetes, and high cholesterol)