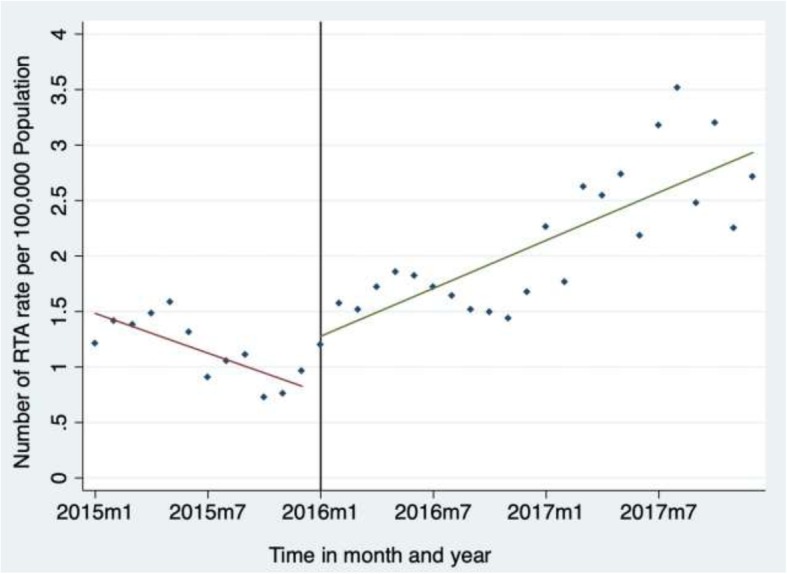
Fig. 1.

Annual and monthly trends in rates of road traffic accidents (RTA) recorded by police stations in seven districts of Guinea from 2015 to 2017. RTA rates per 100,000 population. Fitted values. Fitted values. m1: first month (January) of each year (2015, 2016 and 2017). m7: seventh month (July) of each year (2015, 2016 and 2017)
