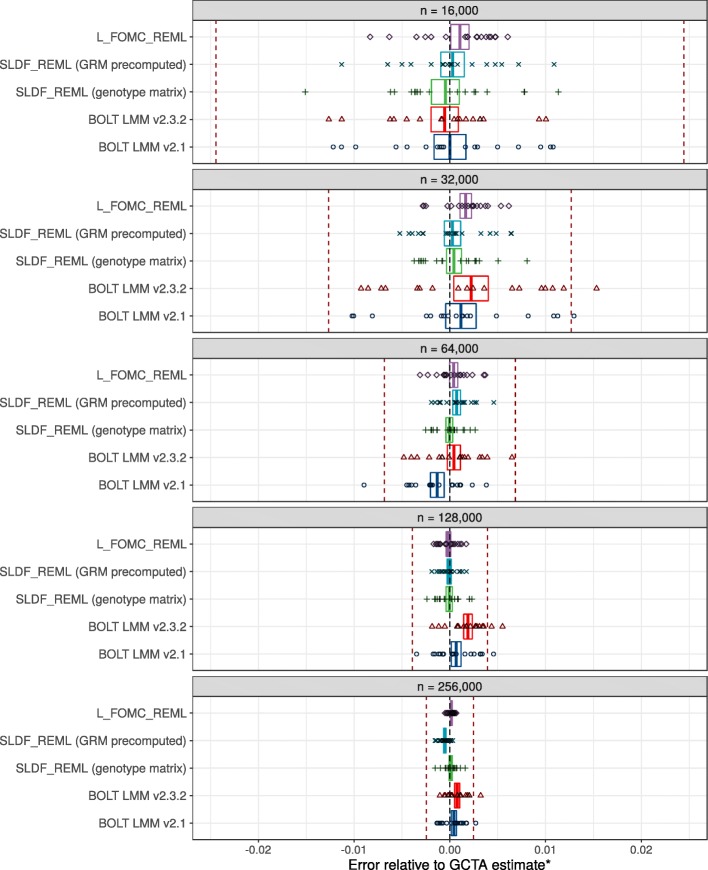
Fig. 4.
Accuracy results. Comparison of heritability estimates for height generated by BOLT-LMM versions 2.1 and 2.3.2, SLDF_REML, and L_FOMC_REML versus those generated by the deterministic algorithm implemented in the GCTA software package ∗ [4], for varying sub-samples of 16,000 to 256,000 unrelated European-ancestry UK Biobank participants. Data are comprised of twenty independent replications per condition. Red dashed lines indicate standard errors of GCTA estimate. Points represent individual observations whereas boxes indicate the 95% confidence intervals for the trimmed mean estimate after a Bonferroni correction for 25 comparisons. The bias evidenced by the BOLT-LMM estimators is likely due to the combination of performing a small number of secant iterations with fixed start values and loose tolerances for determining convergence. ∗For n=256,000, memory requirements prohibited the use of GCTA, so we instead averaged ten estimates generated by the high-accuracy stochastic estimator implemented in BOLT-REML [31] (standard errors were 6.32e-5 and 2.45e-7 for the mean REML heritability estimate and its standard error, respectively)

