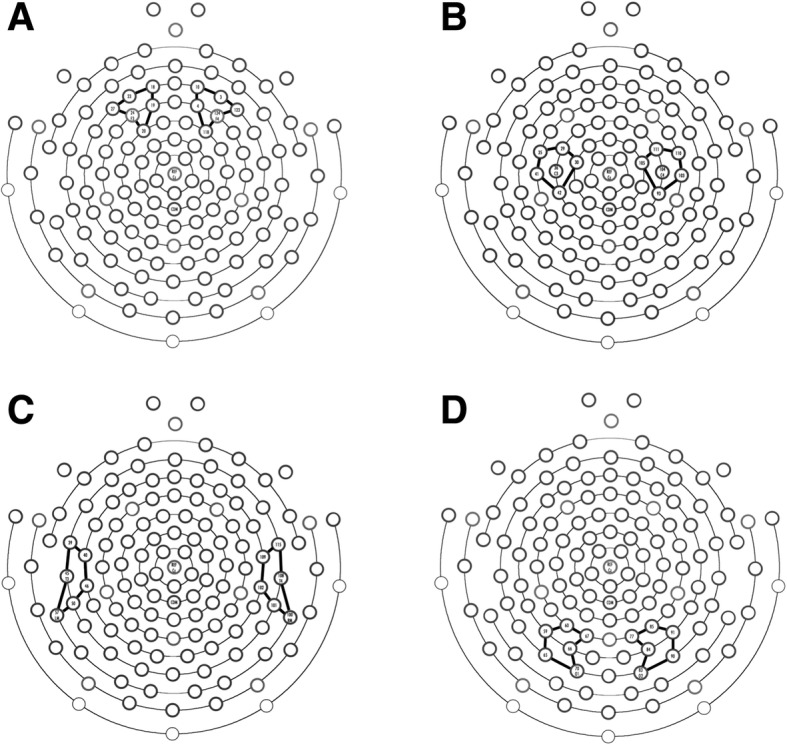
Fig. 1.

Regions of interest utilized for power spectral analysis. Brain regions and electrode groupings were established based on prior literature and through mathematically determining the five closest electrodes to the electrodes associated with the underlying brain region based on the International 10–20 system. a Frontal electrodes included 18, 19, 20, 23, 24 (F3), and 27 on the left and 3, 4, 10, 118, 123, and 124 (F4) on the right. b Central electrodes included 29, 30, 35, 36 (C3), 41, and 42 on the left and 93, 103, 104 (C4), 105, 110, and 111 on the right. c Temporal electrodes included 39, 40, 45 (T3), 46, 50, and 57 on the left and electrodes 100, 101, 102, 108 (T4), 109, and 115 on the right. d Occipital electrodes included 59, 60, 65, 66, 67, and 70 (O1) on the left and 77, 83 (O2), 84, 85, 90, and 91 on the right
