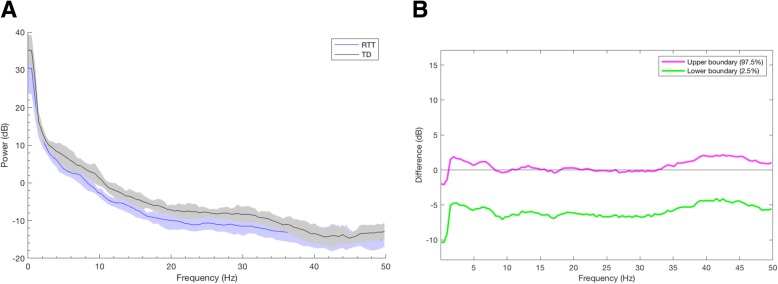
Fig. 2.
Power spectrum based on clinical diagnosis (RTT or TD). a Frontal power spectrum demonstrating that girls with RTT (blue) have decreased power in the lower to middle frequency bands when compared to TD controls (black). b Differences in frontal power spectra presented with 95% CI from bootstrap analysis

