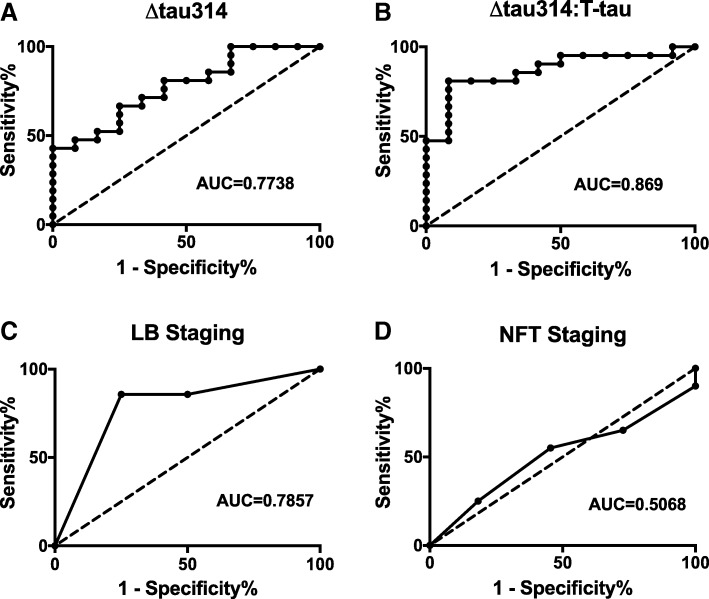
Fig. 5.
ROC analyses of ∆tau314, ∆tau314: T-tau, Lewy body staging, and neurofibrillary tangle staging in LBD versus PD. ROC curve analysis of a ∆tau314, b ∆tau314: T-tau, c Lewy body (LB) staging, and d neurofibrillary tangle (NFT) staging (using Braak criteria). The predictive value for dementia of ∆tau314, ∆tau314: T-tau and Lewy body staging are comparable, and superior to NFT staging. Dotted line is the line of identity (AUC = 0.5)

