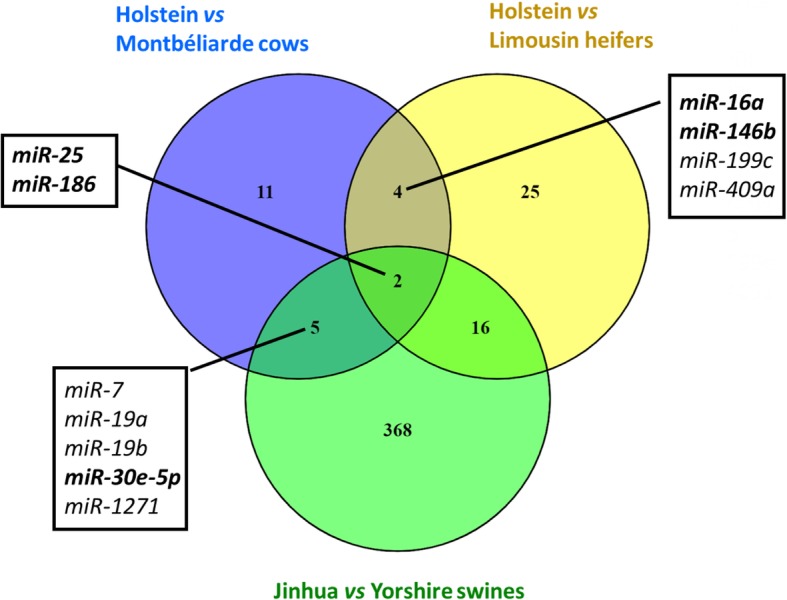
Fig. 3.

Venn diagram of DEMs in different mammary gland studies. The list of the comparison between Jinhua and Yorshine swine and between Holstein and Limousin heifers were from Peng et al. [23] and Wicik et al. [24], respectively. The name of the common miRNAs with the present study was indicated. In bold there were those highly expressed
