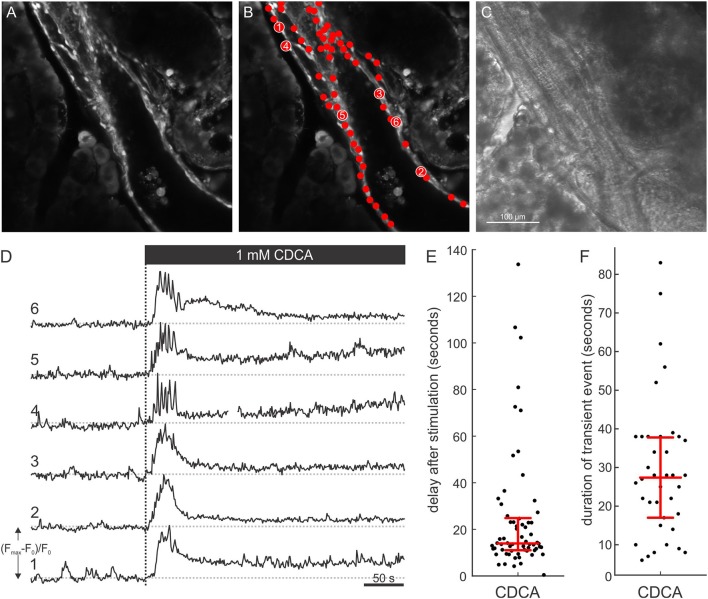
Figure 4.
[Ca2+]i response in ductal cells after stimulation with 1 mM CDCA. (A) Confocal fluorescence image of a ductal structure and surrounding acinar tissue with selected regions of interest (ROI) denoting nuclei of individual PDECs. (B) Chenodeoxycholic acid (CDCA) induced [Ca2+]i responses of individual cells corresponding to numbered ROIs in (B) (1–6). (C) Concurrent transmitted light image. (D) Dashed vertical line indicates the start of exposure to 1 mM CDCA. (E,F) Bee swarm plots with interquartile ranges and medians for delays of responses after stimulation with 1 mM CDCA (n = 65 cells from 4 slices) (E) and durations of transient [Ca2+]i events (n = 38 cells from 4 slices) (F).

