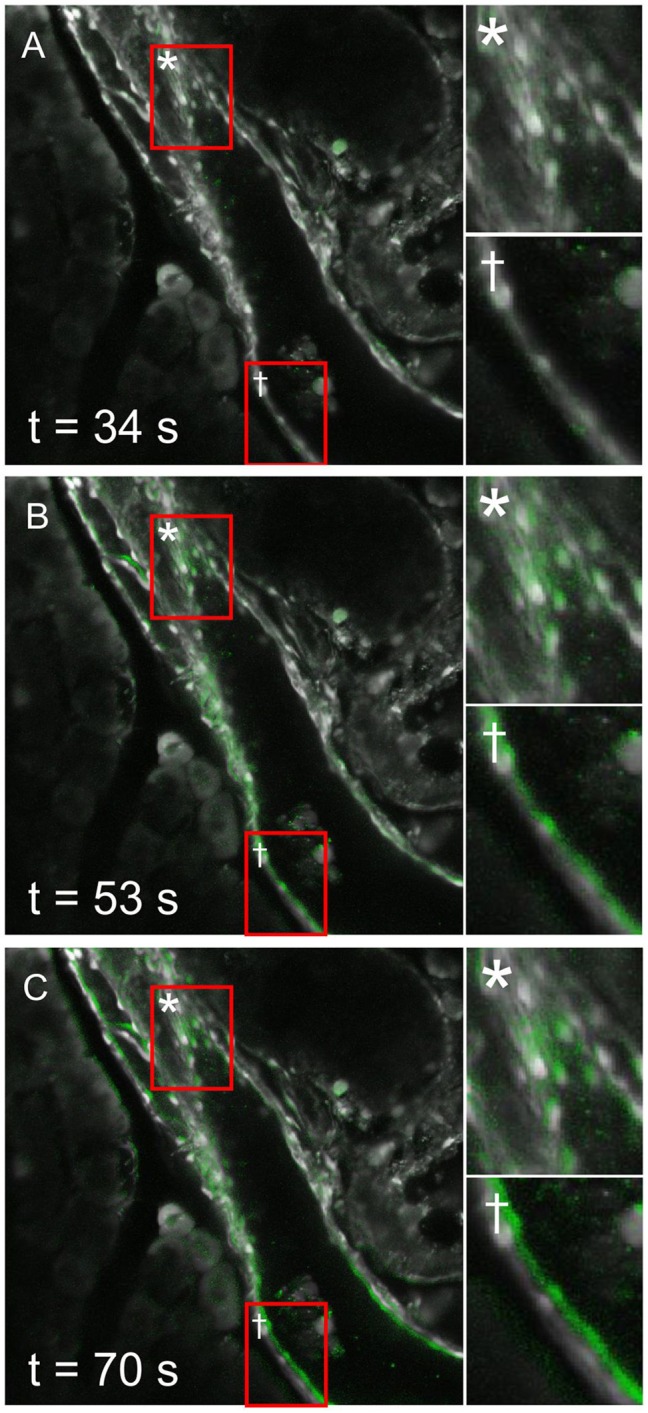
Figure 5.

Spatial displacement of ductal cells after stimulation with 1 mM CDCA. An intralobular duct is shown before (A) and during (B,C) the stimulation with chenodeoxycholic acid (CDCA). Constructs depicting early (B) and late (C) [Ca2+]i response to CDCA display a background of cellular morphology in gray, and an overlay of calcium response in green (see Results section for detailed description). In some PDECs no spatial movement was detected (insets *), whereas in some cells noticeable spatial displacements were observed (insets †). Please note that in the PDECs that were displaced during CDCA response, change in [Ca2+]i preceded the spatial displacement, therefore not interfering with the calcium response detection.
