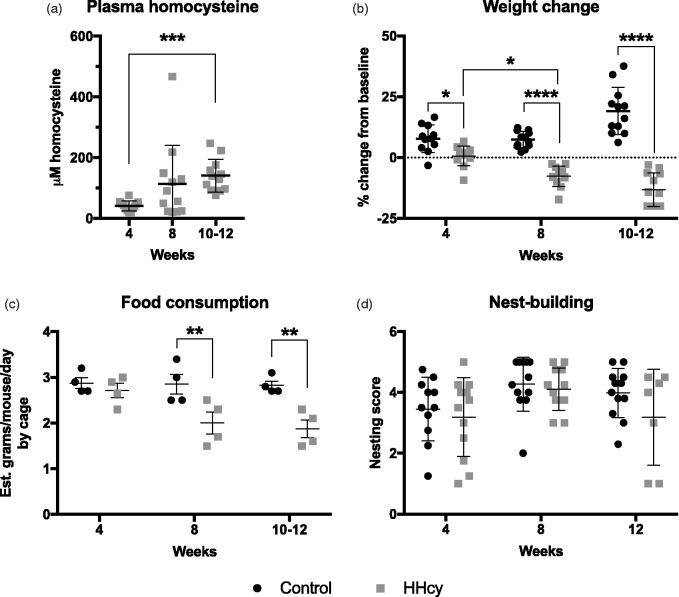
Figure 1.
General health and observations. (a) Levels of homocysteine were measured in plasma after 4, 8, and 10 to 12 weeks on HHcy diet. ***p < .001 versus 4-week time point, Kruskal–Wallis with Dunn’s post hoc testing, n = 12 per group. (b) Percent baseline weight change was significantly reduced in HHcy versus control at all time points. This corresponded with a significant reduction in estimated food consumption by 8 weeks as shown in (c), as an average value calculated by cage (n = 4 per group). No significant changes in intrinsic nest building were detected after any time on diet (d). n = 7 for the 12-week HHcy group and n = 12 for all others (see text). *p < .05, **p < .01, ****p < .001 versus corresponding control group indicated by connector, two-way ANOVA with Sidak’s multiple comparison testing, n = 12 except where indicated.
HHcy = hyperhomocysteinemia.

