Figure 5.

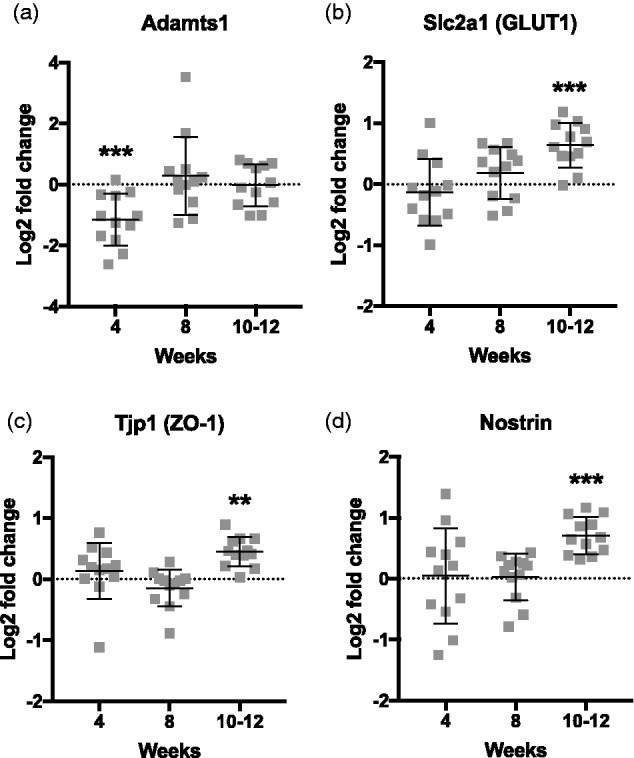
Four vascular-associated genes are significantly altered as a function of time on HHcy diet. Custom TaqMan arrays were run to measure gene expression changes in selected cerebrovascular-associated genes. Data are expressed as log2 normalized fold changes versus corresponding control group. (a) Adamts1 is significantly downregulated at 4 weeks on HHcy diet but returns to baseline by 8 weeks. (b to d) Slc2a1, Tjp1, and Nostrin are significantly upregulated by 10 to 12 weeks on HHcy diet. **p < .01, ***p < .005 versus corresponding control group, two-way ANOVA, n = 11–12 per group.
