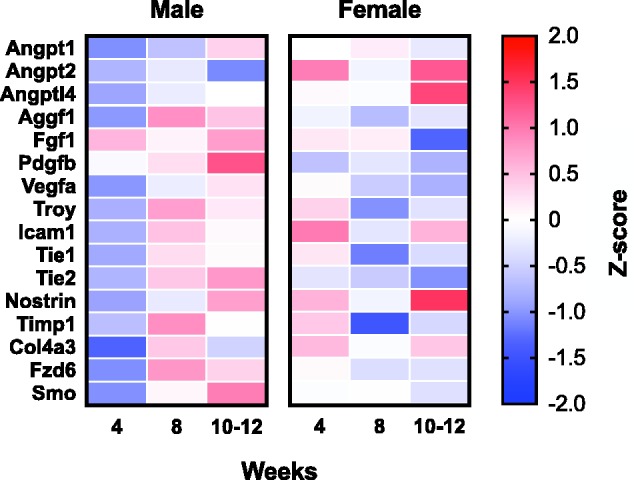
Figure 6.

Sixteen genes show sexual dimorphism in response to HHcy diet. Effect of sex on gene expression changes resulting from HHcy diet was examined across all genes on the TaqMan array by two-way ANOVA. Genes with a significant main effect of sex or significant sex by time interaction are included. Log2 normalized fold change values were converted to standard z scores for comparison.
