Fig. 2.
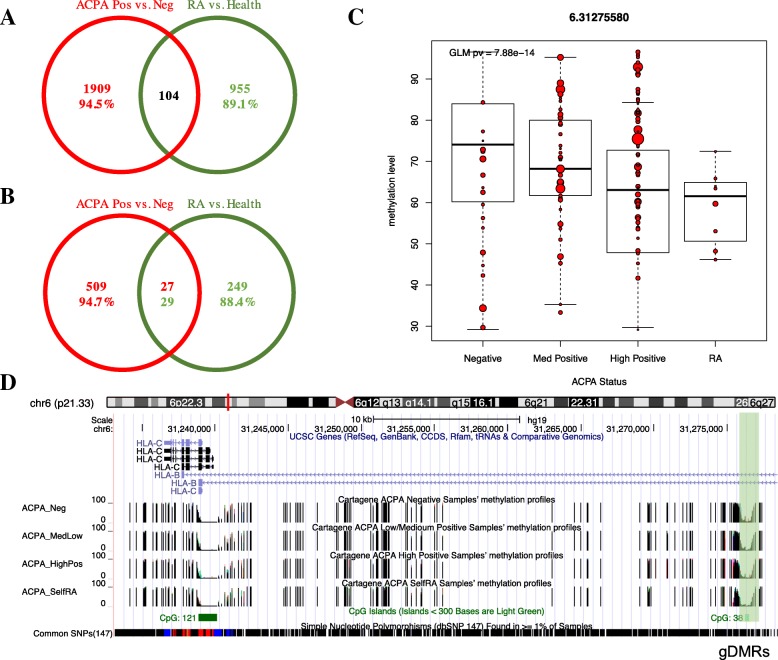
EWAS analysis in ACPA-measured subjects, self-reported RA patients, and dose-dependent DNA methylation analysis. a Venn diagram of DMCs inferred from ACPA-positive vs. ACPA-negative and self-reported RA vs. non-RA healthy. b Venn diagram of DMRs inferred from ACPA-positive vs. ACPA-negative and self-reported RA vs. non-RA healthy. c Three groups were analyzed in an ordinal model relating ACPA level to methylation (ACPA-negative, ACPA-medium-positive, and ACPA-high-positive). A CpG site located at HLA region (e.g., chr6: 31275580) from the ACPA-associated DMRs shows a hypomethylated pattern where methylation decreases from left to right. Methylation level profiles of self-reported RA were also added but not included in the three-group analyses. Dot size represents the sequencing read coverage of the given CpG site per sample. d USCS track browser for the corresponded DMR region associated with the site in c

