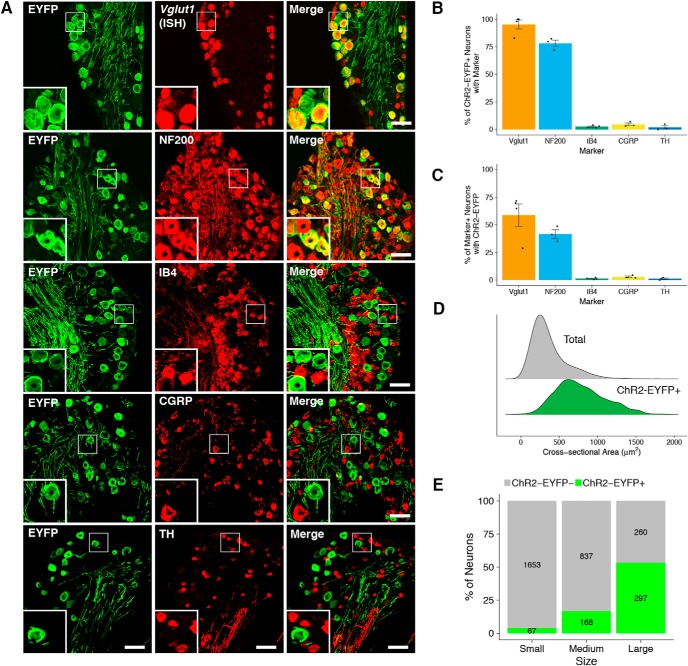
Figure 1.
Cellular distribution of ChR2-EYFP in dorsal root ganglia. A, ChR2-EYFP coexpression with selected markers in DRG. Scale bar, 50 μm. B, C, Quantification of coexpression of ChR2-EYFP with selected markers (mean ± SEM, n = 4 animals, 3–4 sections/animal). D, Size distribution of all (total) and ChR2-EYFP-positive DRG neurons expressed as probability density. E, Proportion of ChR2-EYFP-positive neurons in each size class of DRG neuron. Small: <300 μm; medium, 300–600 μm; large, >600 μm. Values inside bars represent the number of ChR2-EYFP-positive (green) and ChR2-EYFP-negative (gray) neurons in each size class (n = 6 animals, 2–3 sections/animal).

