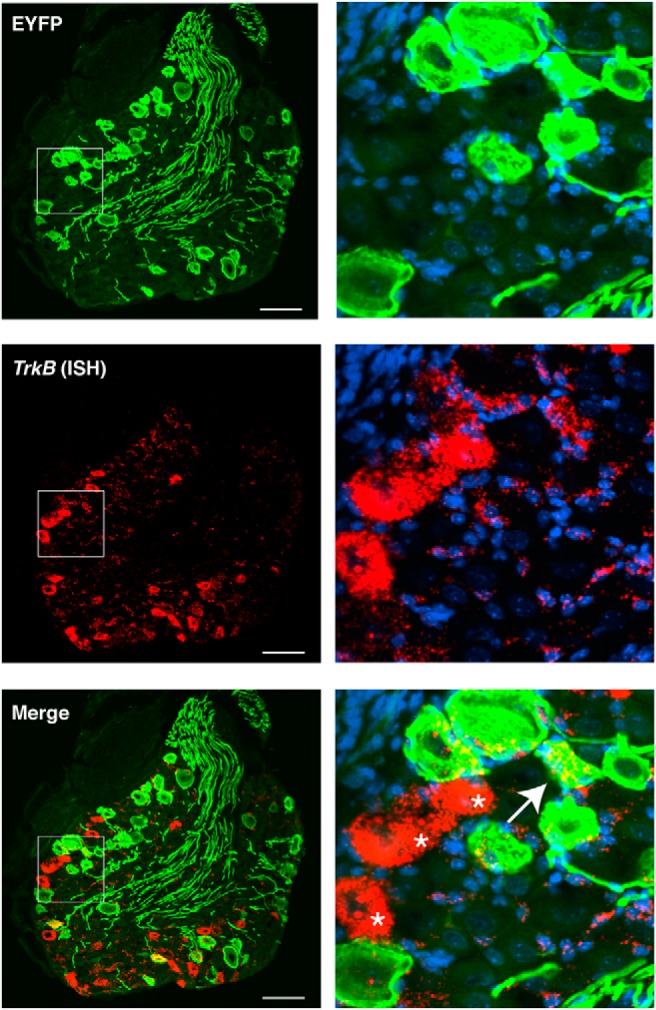
Figure 3.

Expression of TrkB in Vglut1-Chr2 DRG. Left, Coexpression of ChR2-EYFP transcript by ISH. Arrow indicates a ChR2-EYFP-positive neuron coexpressing low levels of TrkB. Asterisk indicates highly expressing TrkB-positive neurons that lack ChR2-EYFP expression, which are likely Aδ-LTMRs. Note the expression of TrkB around the circumference of ChR2-EYFP-positive neurons, likely in satellite glia cells. Scale bar, 50 μm. Right, Magnification of inset.
