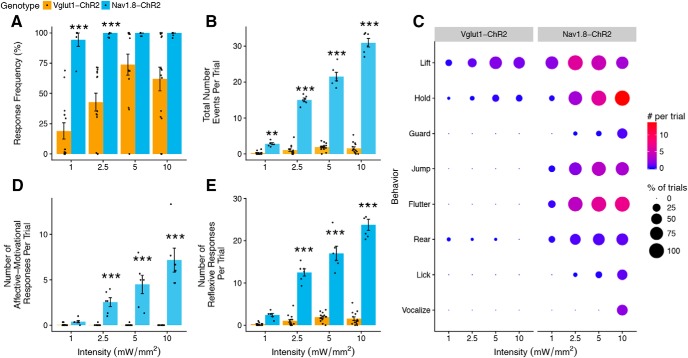
Figure 8.
Comparison of light-evoked withdrawal behaviors in Vglut1-ChR2 and Nav1.8-ChR2 mice. A, Response frequency of Vglut1-ChR2 is lower than that of Nav1.8-ChR2 at all intensities (genotype: F(1,59) = 51.99, p < 0.001. intensity: F(3,59) = 11.07, p < 0.001, genotype × intensity F(3,59) = 3.57, p = 0.02). B, Total number of responses is substantially lower in Vglut1-ChR2 compared with Nav1.8-ChR2 (genotype: F(1,59) = 2034.68, p < 0.001, intensity: F(3,59) = 169.50, p < 0.001, genotype × intensity: F(3,59) = 282.0273, p < 0.001). C, Behavioral signatures of Vglut1-ChR2 and Nav1.8-ChR2 differ markedly. Dot plot representation of individual scored behaviors at each intensity and frequency combination. The size of each dot represents the percentage of trials in which the behavior was observed, and the color represents the total number of a given behavior per trial, with red indicating higher numbers and blue indicating lower numbers. D, Affective–motivational behaviors increase with intensity in Nav1.8-ChR2 but are absent in Vglut1-ChR2 (genotype: F(1,59) = 176.01, p < 0.001, intensity: F(3,59) = 13.03, p < 0.001, genotype × intensity: F(3,59) = 31.75, p < 0.001). E, Number of reflexive responses is higher at all intensities in Nav1.8-ChR2 (genotype: F(1,59) = 964.03, p < 0.001, intensity: F(3,59) = 86.67, p < 0.001, genotype × intensity: F(3,59) = 127.67, p < 0.001). Statistical analysis: two-factor linear mixed effects (LME) model, Tukey's post hoc tests. Vglut1-Chr2, n = 14, and Nav1.8-ChR2, n = 6, for all panels. Post hoc tests: Vglut1-ChR2 versus Nav1.8-ChR2 at each intensity, **p < 0.01, ***p < 0.001. A, B, D, and E are shown as means ± SEM. The data presented here for Vglut1-ChR2 (2 Hz) are replotted from Figure 6.

