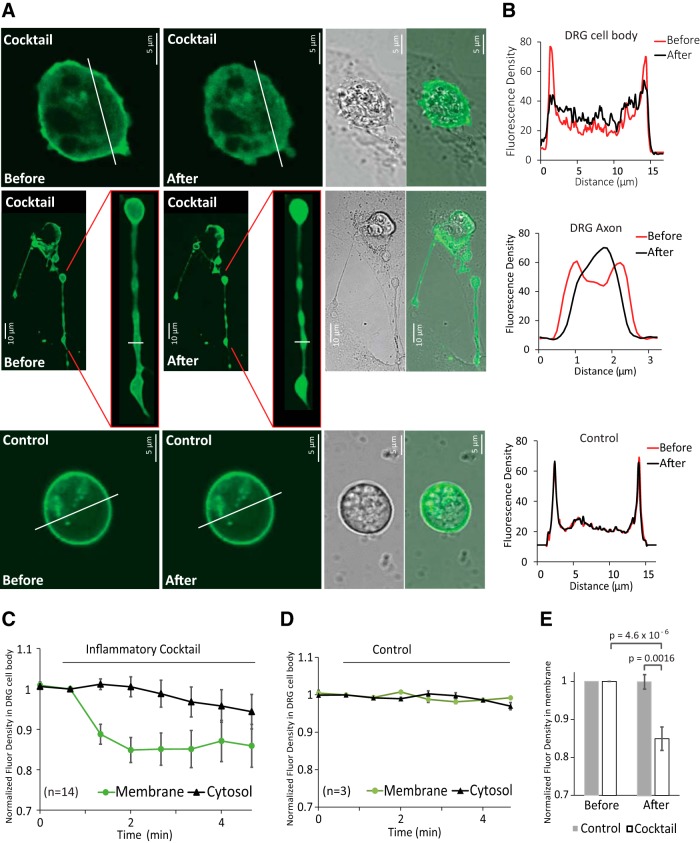
Figure 3.
Receptor-induced decrease of PI(4,5)P2 in the plasma membrane of DRG neurons. A, Confocal images of WT mouse DRG neurons transfected with YFP-tagged R322H Tubby domain as a reporter of plasma membrane PI(4,5)P2. Images are representatives of reporter distribution before and after application of either inflammatory cocktail (same as in Figs. 1 and 2) or control solution (2 mm Ca2+ NCF). Measurements were conducted in 2 mm Ca2+ NCF solution. Neurons were serum deprived in 2 mm Ca2+ NCF solution for 20 min. B, Graphs correspond to fluorescence intensities plotted along the lines indicated in each image in A before (red) and after (black) application of inflammatory cocktail or control. C, D, Time courses of fluorescence density changes for YFP-tagged R322H Tubby in response to control solution (C) or inflammatory cocktail (D) in plasma membrane and cytosol of neuron cell body. E, Statistical analysis of fluorescence density right before and 1 min after application of inflammatory cocktail (n = 14 neurons from 2 independent DRG preparations from 4 mice) and control solution (n = 3) displayed. Bars represent mean ± SEM; statistical significance was calculated with two-way ANOVA (F(3,30) = 12.37, p = 1.9 × 10⁻⁵). Fluorescence density values were normalized to the time point of right before application of inflammatory cocktail or control solution for each group.

