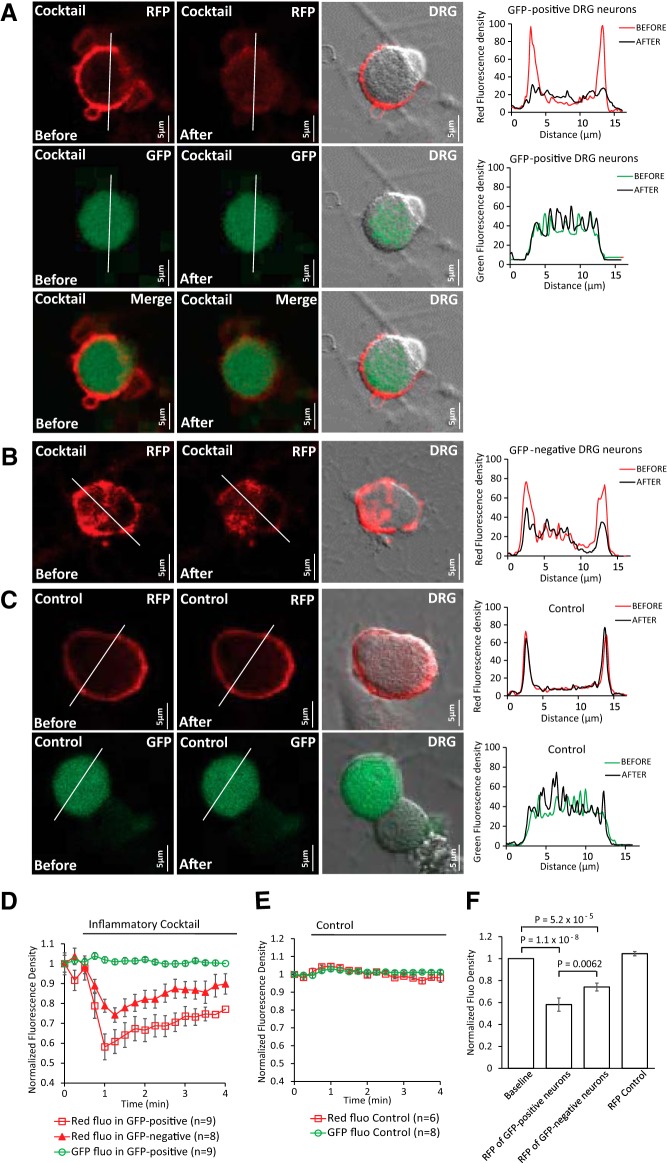
Figure 5.
Receptor-induced decrease of PI(4,5)P2 in TRPM8+ and TRPM8− DRG neurons. A–C, Confocal images of TRPM8-GFP mouse DRG neurons transduced with red PI(4,5)P2 sensor BacMam. Images are representatives of fluorescence density before and after application of either the inflammatory cocktail (same as in Fig. 1) or control solution (2 mm Ca2+ NCF). Graphs correspond to fluorescence intensities plotted along the lines indicated in each image before (red) and after (black) application of cocktail or control. (A, GFP+ DRG neurons with red PI(4,5)P2 sensor; B, GFP− DRG neurons with red PI(4,5)P2 sensor; C, bleaching controls of red fluorescence and GFP fluorescence in neurons). Measurements were conducted in 2 mm Ca2+ NCF solution. D, Averaged time course of fluorescence density changes for red PI(4,5)P2 sensor BacMam and GFP fluorescence in response to cocktail in DRG neurons. Four GFP− neurons with red fluorescence were excluded due to no changes of red fluorescence density after application of cocktail. E, Averaged time course of fluorescence density changes for red PI(4,5)P2 sensor BacMam and GFP fluorescence in response to control solution in DRG neurons. F, Statistical analysis of red fluorescence density at baseline and at the peak response after application of cocktail or control. Data are shown from three different neuron preparations from three mice. Bars represent mean ± SEM; statistical significance was calculated with one-way ANOVA (F(3,28) = 31.02, p = 4.8 × 10⁻⁹). Fluorescence density values were normalized to baseline.

