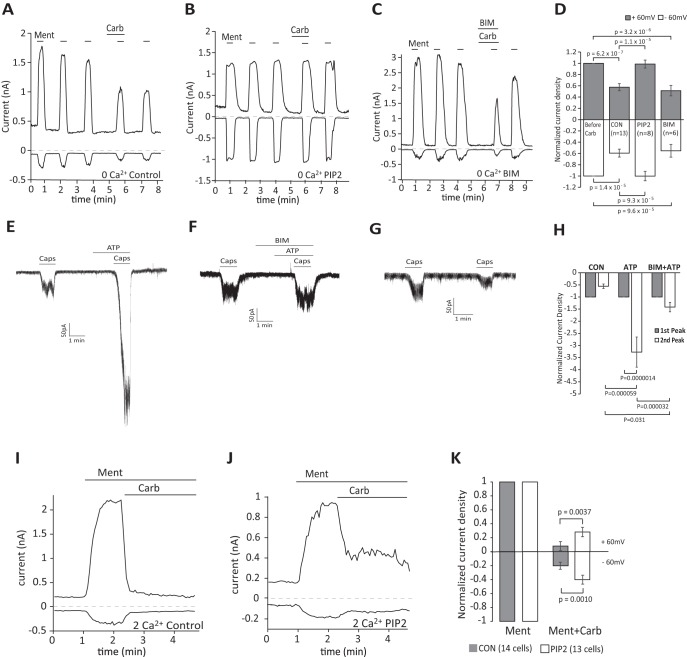
Figure 6.
Intracellular dialysis of PI(4,5)P2 alleviates inhibition of TRPM8 activity by Gαq-coupled receptors in HEK 293 cells. A–C, Representative whole-cell voltage-clamp traces of inward currents recorded at −60 mV and + 60 mV in Ca2+-free NCF solution for HEK 293 cells transfected with TRPM8 channels and M1 receptors [control-no lipid supplement (A), whole-cell patch pipette supplemented with 100 μm diC8PI(4,5)P2 (B), cells treated with the PKC inhibitor BIM IV (1 μm) (C)]. Menthol (200 μm) was applied to activate TRPM8 channels five times, carbachol (100 μm) was applied to activate the M1 receptor. D, Statistical analysis at −60 mV and + 60 mV corresponding to A–C. Bars represent mean ± SEM; statistical significance was calculated with one-way ANOVA(+60 mV: F(3,36) = 20.08, p = 8.1 × 10⁻⁸; −60 mV: F(3,36) = 13.80, p = 3.8 × 10⁻⁶). Current values were normalized to the third current response to menthol. E–G, Representative whole-cell voltage-clamp traces of inward currents recorded at − 60 mV in Ca2+-free NCF solution for HEK 293 cells transfected with TRPV1 channels; applications of 20 nm capsaicin, 100 μm ATP, and 1 μm BIM are indicated by the horizontal lines. H, Statistical analysis of control (n = 6 cells), ATP (n = 6 cells), and BIM+ATP (n = 6 cells) both at −60 mV (corresponding to E–G). Bars represent mean ± SEM; statistical significance was calculated with two-way ANOVA (F(5,30) = 13.03, p = 8.8 × 10⁻⁷). Current values of the second peak were normalized to the first peak induced by capsaicin. I, J, Representative whole-cell voltage-clamp traces of inward currents recorded at − 60 mV and + 60 mV in 2 mm Ca2+ NCF solution for HEK 293 cells transfected with TRPM8 channels and M1 receptors; applications of 200 μm menthol and 100 μm carbachol are indicated by the horizontal lines; 100 μm diC8 PI(4,5)P2 was added to the whole-cell patch pipette solution in J, no lipid was added in I. K, Statistical analysis of n = 14 cells (control) and n = 13 cells (diC8 PI(4,5)P2) both at −60 mV and +60 mV (corresponding to I and J). Bars represent mean ± SEM, two-way ANOVA (+60 mV: F(3,50) = 106.8, p = 0 and −60 mV F(3,50) = 104.0, p = 0). Current values at the time point of 1.5 min after application of carbachol were analyzed. Current values were normalized to the peak current value under menthol application before carbachol.

