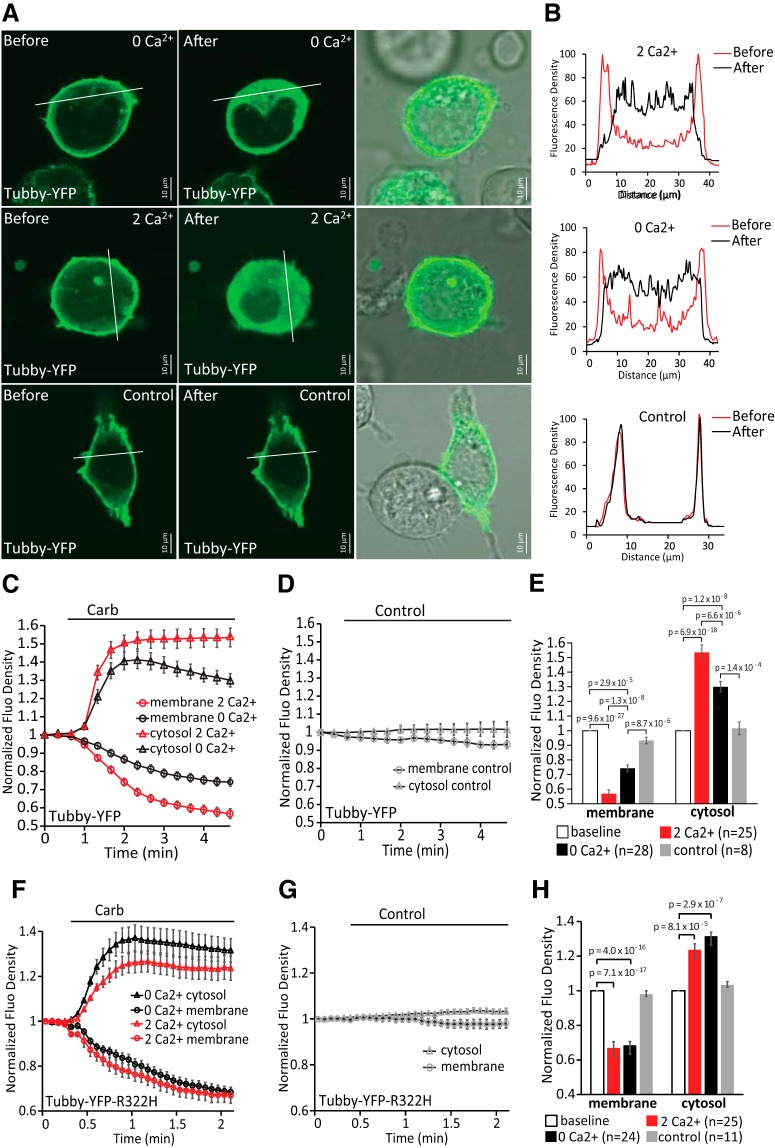
Figure 7.
Receptor-induced depletion of PI(4,5)P2 in the plasma membrane of HEK 293 cells in the presence or absence of calcium. A, Confocal images of HEK 293 cells transfected with YFP-tagged WT Tubby domain as reporters of plasma membrane phosphoinositides and M1 receptor in 2 mm Ca2+ NCF or Ca2+-free NCF solution. Images are representatives of reporter distribution before and after application of either 100 μm carbachol or control solution (2 mm Ca2+ NCF). B, Graphs correspond to fluorescence intensities plotted along the lines indicated in each image in A before (red) and after (black) application of carbachol or control. C, D, Time courses of fluorescence density changes for YFP-tagged WT Tubby in response to carbachol (C) or control (D) in plasma membrane and cytosol of HEK 293 cells. E, Statistical analysis of fluorescence density at baseline and at the end after application of carbachol (n = 25 for 2 mm Ca2+ NCF, n = 28 for Ca2+-free NCF) and control (n = 8) is shown. Bars represent mean ± SEM; statistical significance was calculated with one-way ANOVA (membrane: F(3,85) = 89.12, p = 0; cytosol: F(3,85) = 45.20, p = 0). Fluorescence density values were normalized to the baseline for each group. F, G, Similar experiments to those shown in C and D in HEK293 cell transfected with YFP-tagged R322H Tubby domain and M1 receptors. H, Statistical analysis of fluorescence density at baseline and at the end after application of carbachol (n = 25 for 2 mm Ca2+ NCF, n = 24 for Ca2+-free NCF) and control (n = 11) is shown. Bars represent mean ± SEM; one-way ANOVA (membrane: F(3,80) = 57.41, p = 0; cytosol: F(3,80) = 12.97, p = 5.5 × 10⁻⁷). Fluorescence density values were normalized to the baseline for each group.

