Figure 9.
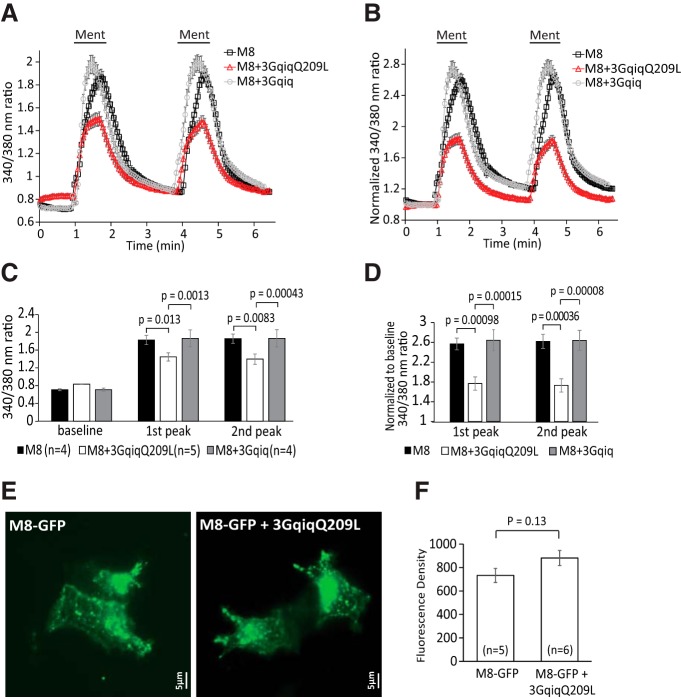
A PLC-deficient Gαq chimera inhibits TRPM8 activity, but does not decrease cell surface expression A, Ca2+-imaging measurements (mean ± SEM) of HEK 293 cells transfected with TRPM8 plus 3GqiqQ209L or 3Gqiq in response to two applications of 200 μm menthol. B, Pooled data of A normalized to baseline. C, D, Statistical summary of A and B, respectively. Bars represent mean ± SEM; statistical significance was calculated with two-way ANOVA (F(8,30) = 25.55, p = 2.2 × 10⁻¹¹ for C and F(5,20) = 11.10, p = 3.2 × 10⁻⁵ for D). Fluorescence values of 340/380 ratio were normalized to the baseline for each group. Two peaks of menthol responses were analyzed; for the TRPM8 group n = 4 slides (103 cells), for the TRPM8 + 3GqiqQ209L group n = 5 slides (84 cells), and for the TRPM8 + 3Gqiq group n = 4 slides (103 cells). E, Representative TIRF images from HEK293 cells cotransfected with GFP-TRPM8, or GFP-TRPM8 plus 3GqiqQ209L. TIRF images were obtained 24–36 h after transfection, as described in the Materials and Methods section. F, Summary for data obtained from five and six coverslips from three different transfections. The experimenter blinded to the transfection collected similar number of random images from each cover slide. The average fluorescence intensity of cells from one cover slide was taken as one individual data point. The total number of cells analyzed was 139 for TRPM8 and 148 for TRPM8 plus 3GqiqQ209L. Statistical comparison was performed with two-sample t test.

