
Figure 6.
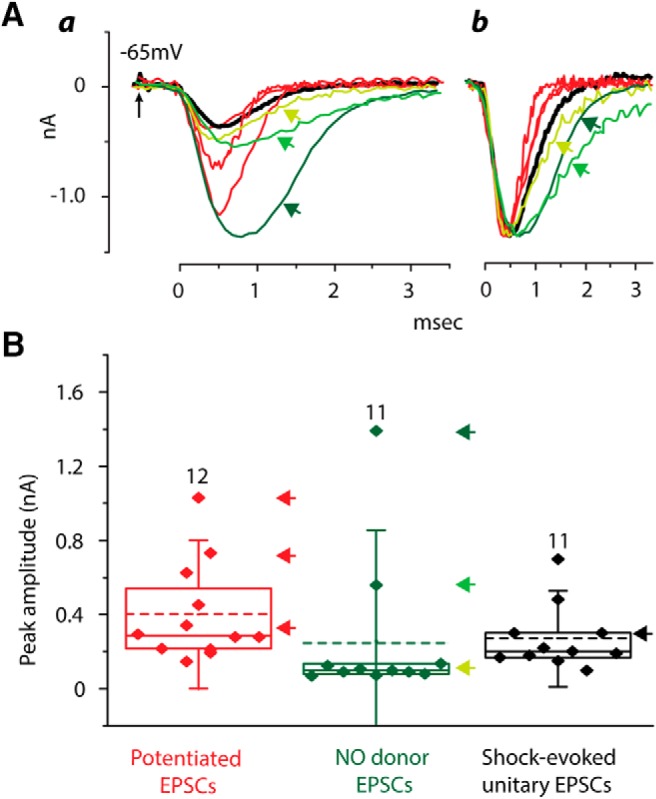
EPSCs evoked by potentiation (red), by the application of an NO donor (green), and by a shock to a bundle of auditory nerve fibers that is just strong enough to evoke a response (black) are compared. Aa, Superposition of EPSCs evoked in differing ways allows their kinetics to be compared. EPSCs evoked by shocks (thick black), by potentiation (red) and some of those evoked by an NO donor (yellow green) are similar. In a few cells, EPSCs evoked by the NO donor were broader and larger than the others (bright green, dark green). Ab, Those same traces are normalized and aligned at the halfway point of the rise of the EPSCs, showing that in two cells the EPSCs evoked by the application of NO were broader and slower than most EPSCs (bright green and dark green). B, Plot compares amplitudes of EPSCs evoked in the three ways. Each point represents the average amplitude of EPSCs in one cell. The dashed lines show the mean of those mean amplitudes, the solid lines show the median, boxes enclose the 25–75% range, and whiskers represent SD. The cells from which the traces in A were taken are marked with arrows whose color matches traces and arrows in Figure 6A.