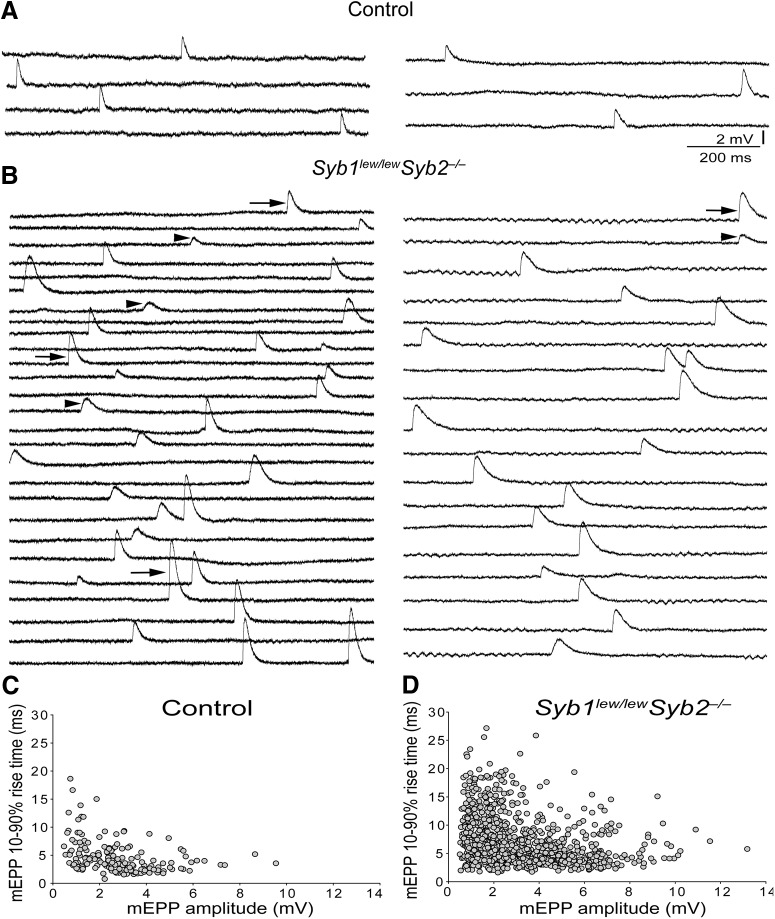
Figure 9.
Syb1lew/lewSyb2−/− NMJs exhibit an increase in mEPP amplitude and rise time. A, B, Sample mEPP traces recorded in control (A) and Syb1lew/lewSyb2−/− mice (B). In both control and Syb1lew/lewSyb2−/− mice, recordings from 2 muscle fibers are shown (1 on the left panel and 1 on the right panel). Each panel includes all mEPP events recorded in the same muscle fiber during a 3 min period. Within each panel, each trace represents a 1 s recording in which mEPP events occurred. Traces that did not contain any mEPPs are not shown. mEPPs appear in a broad range of amplitude and time course. Examples of fast (arrows) and slow (arrowheads) mEPPs are shown in B. C, D, Scatter plots displaying mEPP amplitude (x axis) versus 10%–90% rise time (y axis). Each dot represents a single mEPP recorded in control or Syb1lew/lewSyb2−/− mice. The data displayed in the graphs are pooled from 190 events in control mice (n = 55 cells, N = 10 mice) and 996 events in Syb1lew/lewSyb2−/− mice (n = 63 cells, N = 11 mice).

