
Figure 13.
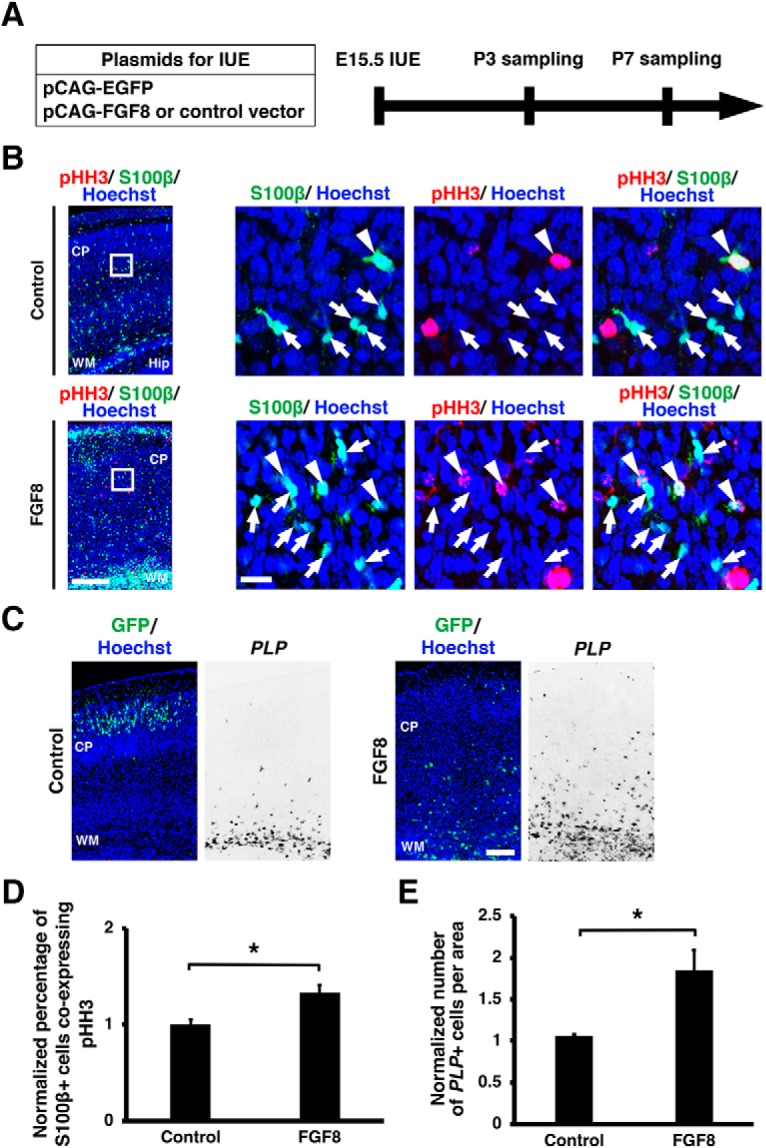
Activation of FGF signaling promotes astrocyte proliferation and oligodendrogenesis. A, Schematic of experiment. pCAG-EGFP plus either pCAG-FGF8 or pCAG control vector was introduced into the mouse cerebral cortex by IUE at E15.5, and coronal sections were prepared at P3 for pHH3 and S100β immunostaining and at P7 for PLP in situ hybridization. B, Immunohistochemistry for pHH3 and S100β. Arrows indicate S100β-positive/pHH3-negative cells, whereas arrowheads indicate S100β-positive cells coexpressing pHH3. Scale bars: left, 200 μm; right, 20 μm. C, In situ hybridization for PLP. PLP-positive cells were increased by FGF8. Scale bar, 200 μm. D, Quantification of the percentage of S100β-positive cells coexpressing pHH3 in the cortex. The percentage of S100β-positive cells coexpressing pHH3 in the electroporated side of the cortex were divided by those in the contralateral non-electroporated cortex (unpaired Student's t test, *p = 0.0282). Error bars represent mean ± SEM. E, Quantification of the number of PLP-positive cells in the cortex. The numbers of PLP-positive cells in the electroporated cortex were divided by those in the other non-electroporated cortex (unpaired Student's t test, *p = 0.0289). Error bars represent mean ± SEM. CP, cortical plate; Hip, Hippocampus; WM, white matter.