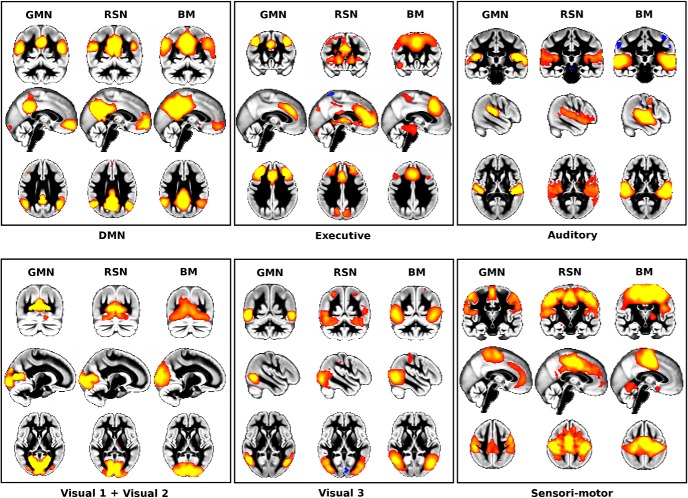
Figure 1.
GMNs map onto canonical functional networks identified in Smith et al. (2009) in both rest and task fMRI. The GMNs (GMNs, left in each panel) spatially correspond to the previously matched functional networks obtained using a data-driven approach (RSNs, middle of each panel; BrainMap task-related fMRI networks, obtained from nearly 30,000 subjects: BM, right in each panel). Due to a higher degree of fragmentation in the structural data, we averaged the two structural DMNs, DMN 1 and DMN 2, and the three structural sensorimotor networks. The spatial correlation coefficients obtained between GMNs and a given set of functional networks were mainly consistent with those observed between the two functional datasets (Table 2). By radiological convention, left is right in all figures.

