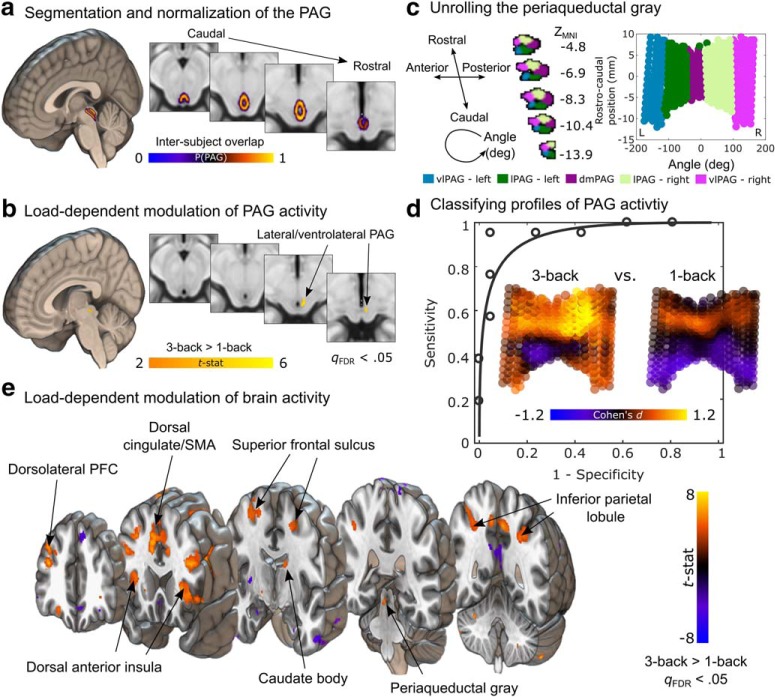
Figure 1.
Load-dependent brain activity during the N-back task. a, Anatomical segmentation and normalization of periaqueductal tissue, including the superior portion of the dorsal raphe and PAG. Rendering depicts a group-based probabilistic atlas of human PAG overlaid on the ICBM152 template in MNI space. The color map indicates the proportion of subjects with overlapping PAG segmentations at each voxel. b, Load-dependent modulation of PAG activity during the N-back task. The color map reflects t-statistics from a one-sample t test conducted on contrasts of three-back vesus one-back conditions, showing greater activation during the three-back task in lateral/ventrolateral PAG. c, Parametrization and unsupervised clustering of PAG voxels within the group-based PAG atlas (thresholded at 20% overlap) based on their spatial location (with rostrocaudal and angular dimensions identified using principal components analysis and conversion to polar coordinates) produce a five-cluster columnar organization. The PAG can be unrolled and displayed along these two principal dimensions (right). d, Classification of PAG activity along high and low levels of memory load. Inset plots depict effect size maps (Cohen's d) for the three-back and one-back conditions. Receiver operating characteristic curve shows high discriminability of high and low working memory load when testing on data from an independent subject (AUC = 0.972, two-alternative forced choice, p < 0.0001, permutation test). e, Mass-univariate whole-brain analysis reveals multiple cortical and subcortical regions that are more active as working memory load increases in the N-back task. Color map reflects t-statistics from a one-sample t test conducted on contrasts of three-back versus one-back conditions. Yellow (and orange) colors indicate greater activation during the three-back task, whereas blue colors indicate higher levels of activity during the one-back task.

