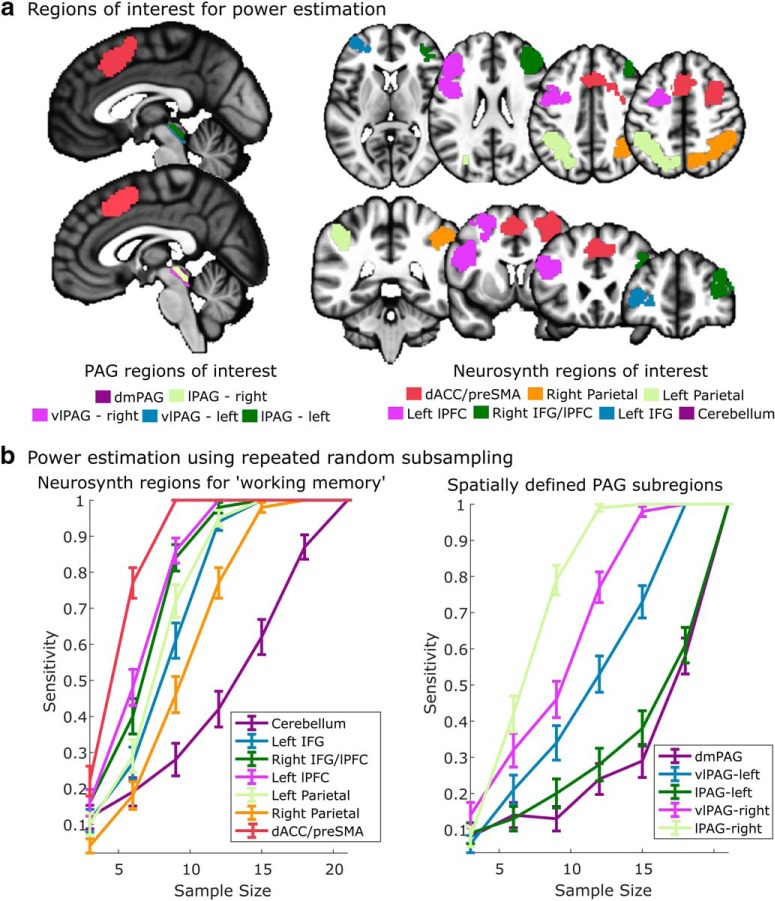
Figure 2.
Power analysis using functionally independent ROIs. a, ROIs identified based on spatial clustering of PAG voxels (shown in the sagittal slices on the left) and automated meta-analysis of the term “working memory” using Neurosynth (Yarkoni et al., 2011). b, Power curves estimated using repeated random subsampling (up to the full sample of 21 subjects). The vlPAG and lPAG (in the right hemisphere) exhibit >80% power with <15 subjects (left). All cortical regions exhibit 80% or greater power with <15 subjects (right).

