Figure 3.
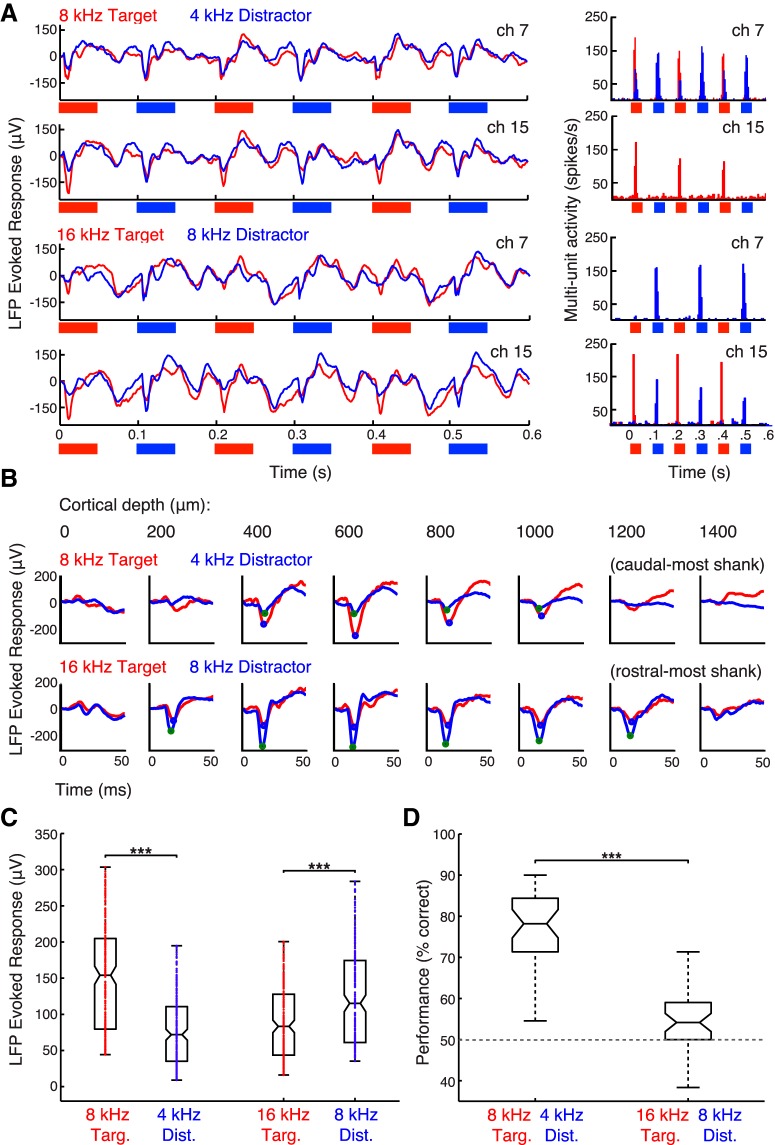
Neural responses to pure tone sequences in rat A1 and their discriminability in the 2-AFC task. A, Mean LFP traces and corresponding MUA PSTHs for two channels on neighboring shanks in an example recording session of a passively-listening animal. Evoked responses to the first six tones of the interleaved target/distractor sequence (8T4D, top; 16T8D, bottom) are shown. Red traces and red PSTH bars (5 ms bins) correspond to trials in which the target was presented contralaterally to the recorded hemisphere; blue, to trials in which the distractor was presented contralaterally. B, Cortical depth profile for tone-evoked LFP responses on a caudal-most and a rostral-most shank in an example recording session of a behaving animal. eLFP responses to the first target and first distractor tones of the interleaved sequence are shown overlaid (8T4D, top; 16T8D, bottom). Though the shanks are separated by 1200 μm on the auditory cortical tonotopic map, 8 kHz drives the stronger response in both locations. C, Absolute values of the first-tone eLFP waveform minima (B, circled blue and green) are taken from all the tone-responsive channels of five array implants in three behaving animals over 56 recording sessions to show the population distributions of eLFP amplitudes evoked by the target and distractor tones in rat A1. The median response for 8 kHz is stronger whether it is the target in the 4 kHz pairing (left box plots; n = 241) or the distractor in the 16 kHz pairing (right box plots; n = 238; Wilcoxon signed rank test, ***p < 0.001). D, Distribution of mean animal performance in individual behavioral sessions for 8T4D (left; 35 sessions) and 16T8D (right; 41 sessions). Rats perform better when 8 kHz is the target rather than the distractor (Wilcoxon rank sum test, ***p < 0.001).

