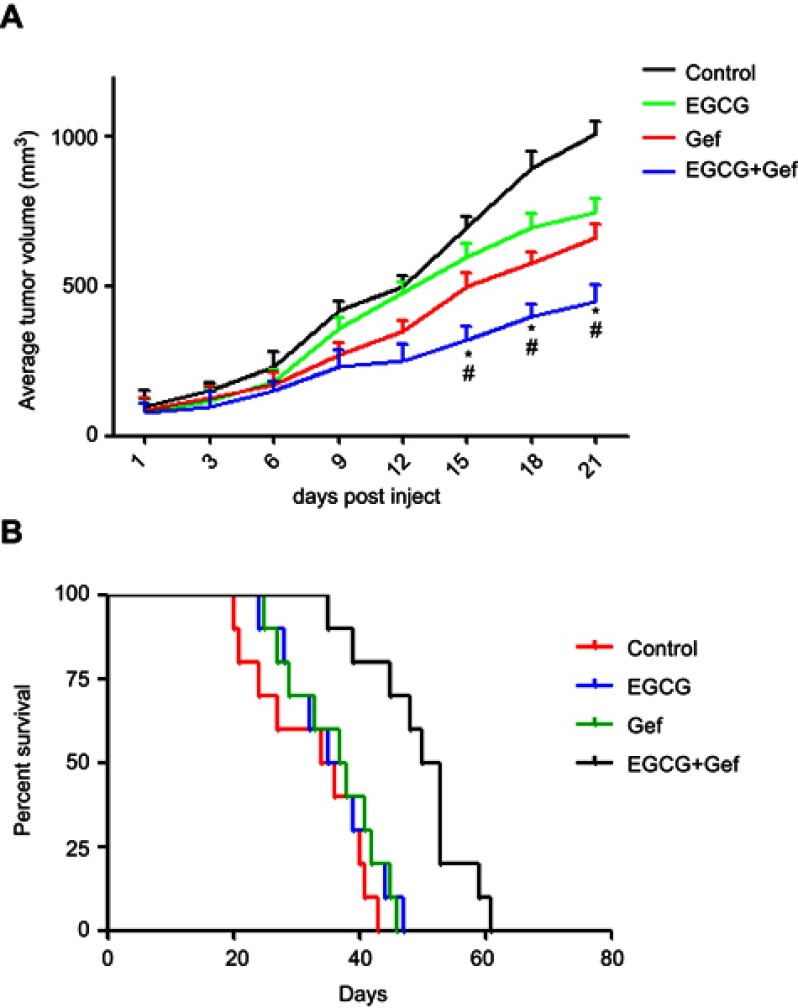
Figure 2.
EGCG and Gef synergized in suppressing tumor growth in the xenograft mouse model. (A) Inhibitory effects of different treatments on tumor volume in a xenograft mouse model. Data are shown as mean ± SEM. *P<0.05 vs Gef-alone treatment group, #P<0.05 vs EGCG-alone treatment group (n=10). (B) Illustration of the survival periods of xenograft-bearing mice treated with different treatments. Control (normal saline), EGCG (200 mg/kg/day, p.o.), Gef (10 mg/kg/day, p.o.), Gef plus EGCG (10 mg/kg/day Gef +200 mg/kg/day EGCG, p.o.). Day 0 was used to represent the starting of treatment (n=10).
Abbreviations: EGCG, epigallocatechin gallate; Gef, gefitinib.

