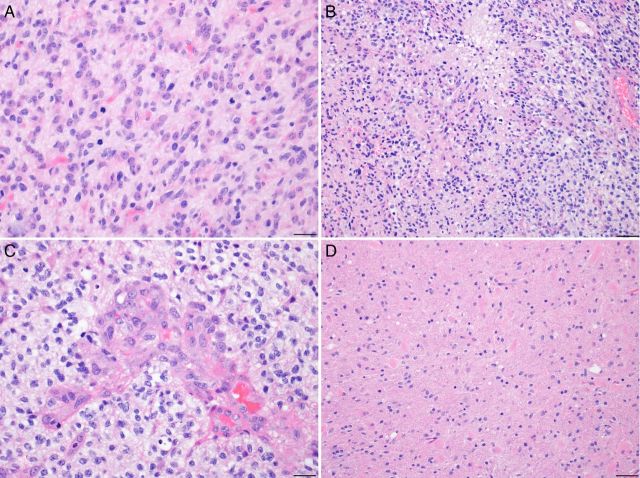
Fig. 3.
The biopsies demonstrated an infiltrating population of atypical astrocytic cells, showing (A) brisk mitotic activity, (B) tumor necrosis, and (C) microvascular proliferation, consistent with a diagnosis of glioblastoma. A biopsy from the periphery of this mass may show (D) a low-to-moderately cellular tumor, with or without mitoses, corresponding to a lower histological grade. In images (A) and (C), photographed at 400× magnification, the scale bars on the bottom right represent 20 µm. In images (B) and (D), photographed at 200× magnification, the scale bars represent 50 µm.

