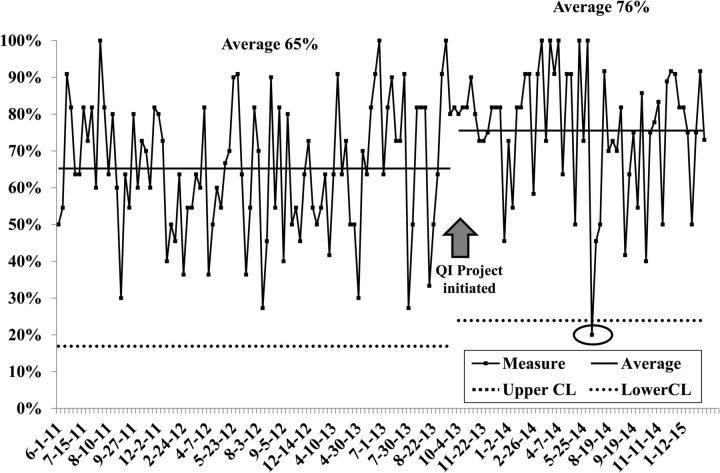
Fig. 2.
Individual value and moving range (XmR) chart of percent standards of care achieved by patients with glioma pre- and post-quality improvement work, June 2011 – September 2013 and October 2013 – March 2015.a,b CL = control limit, % = percent; QI = quality improvement. aCircle delineates a special cause event. bEach data point represents a single observation. Upper and lower control limits are set at 3-sigma to minimize the risk of a type I error.

