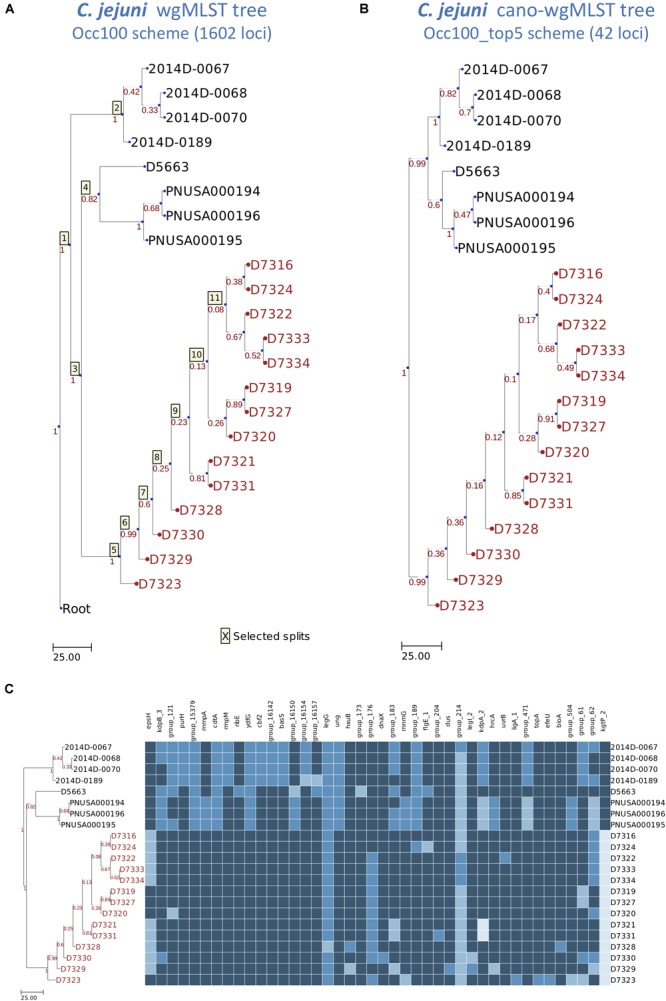
FIGURE 4.

Dendrogram and heatmap constructed using wgMLST profiles for 22 Campylobacter jejuni isolates. (A) The wgMLST tree generated on the basis of the Occ100 scheme (1602 loci). (B) The cano-wgMLST tree generated on the basis of the Occ100_top5 scheme (42 loci). The Occ100 scheme refers to the set of loci that are present in all isolates, and the Occ100_top5 scheme is a subset of the Occ100 scheme that unites the five most discriminatory loci for each split. Outbreak or event-related taxa are colored red. (C) The heatmap of 42 highly discriminatory loci. Different alleles in the same column are indicated by different colors.
