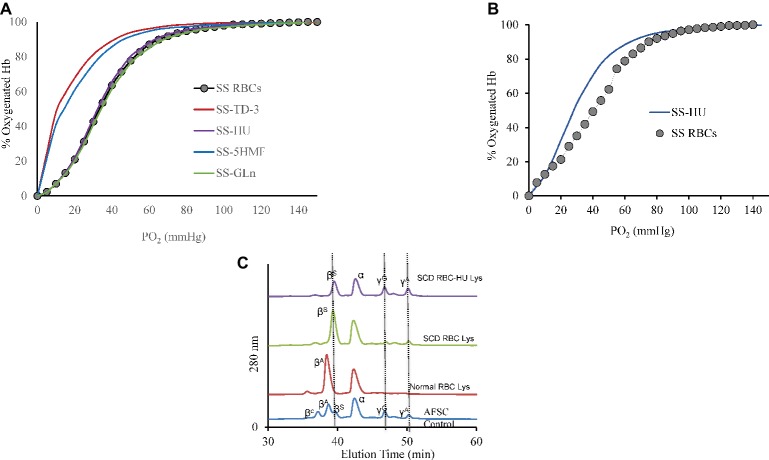
Figure 2.
Oxygen dissociation curves (ODC) of SS intact cells after treatment with the antisickling agents. (A) Suspensions of SS cells [hematocrit (20%)] were incubated in the presence of antisickling agent at 37°C for 15 min (TD-3) or 1 h (the other antisickling agents) prior to determination of the ODC using Hemox Analyzer. Oxygen dissociation curves (ODC) of SS cells with 2 mM TD-3, 5HMF, HU, or glutamine is shown in the Figure. (B) Left-shift of the oxygen dissociation curve (ODC) of sickle cell patient blood who was on HU compared to patient who was not on treatment of HU. (C) RP-HPLC data of lysate from patient with and without HU treatment. Hb (0.96 mg) was injected into C3 column. The mobile phase consisted of (1) 0.1% TFA in water and (2) 0.1% TFA in acetonitrile. A gradient was programmed to increase from 35 to 53% Buffer B over 80 min. Solvents were mixed and run at a rate of 1 ml/min and absorbance was monitored at 280 and 405 nm. AFSC is monitored at 280 and is shown as control.

