Figure 1.

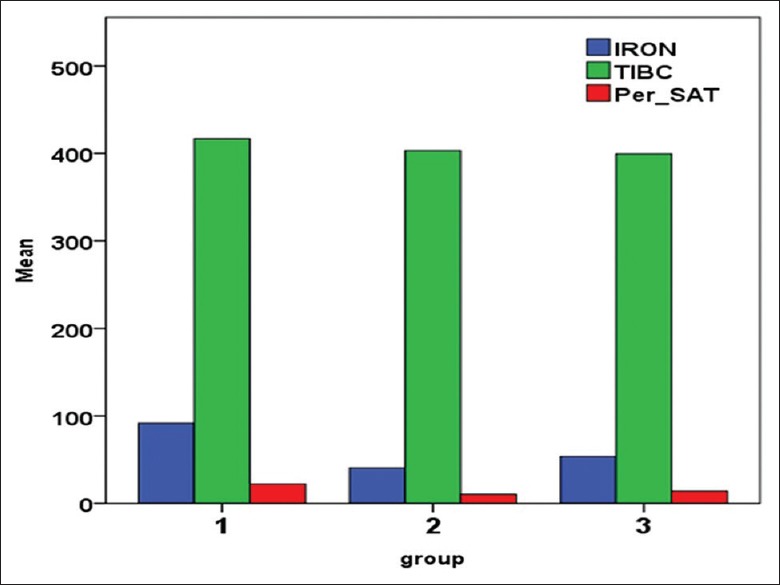
Mean values of S Iron, TIBC, and Per_SAT in the three groups. S Iron - Serum iron concentration, TIBC - Total iron binding capacity, per_SAT - Percentage saturation

Mean values of S Iron, TIBC, and Per_SAT in the three groups. S Iron - Serum iron concentration, TIBC - Total iron binding capacity, per_SAT - Percentage saturation