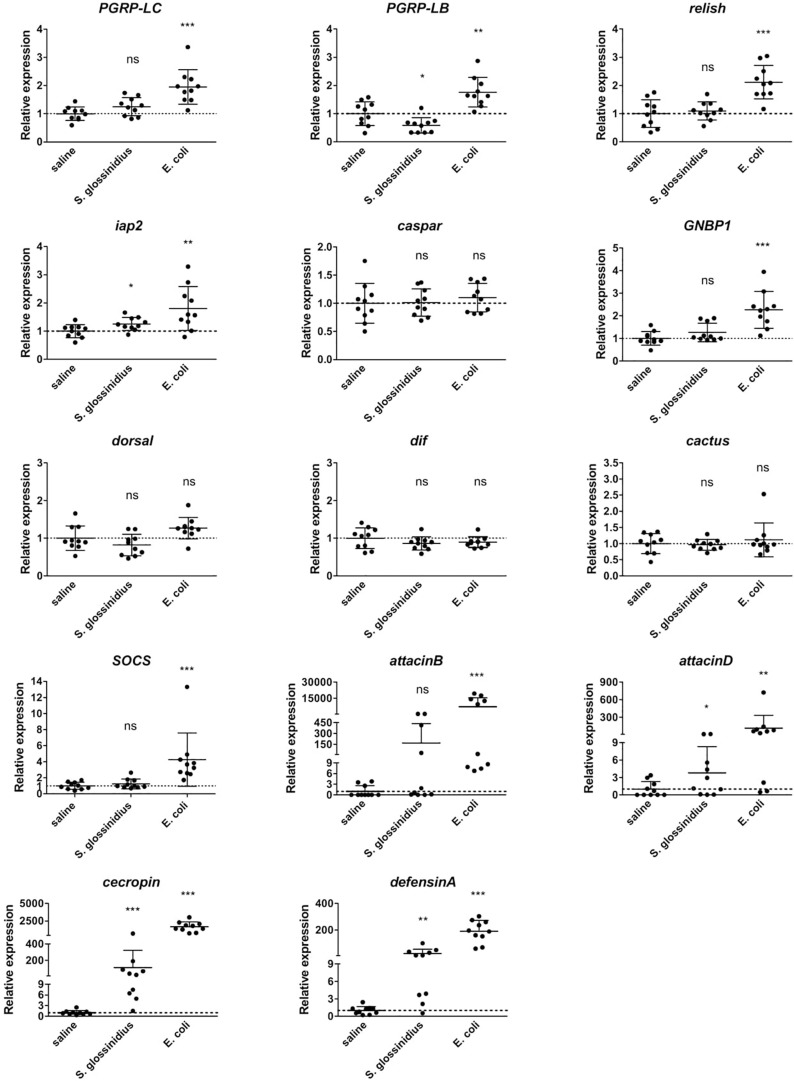
FIGURE 4.
Relative expression levels of innate immunity-related genes obtained by qRT-PCR analysis in S. glossinidius-free (GmmSod–) flies exposed to 106 CFU Sodalis glossinidius or 105 CFU E. coli and their corresponding injection-control with sterile saline. Bacterial exposure was performed on day 8 post-eclosion via intrathoracic microinjection as well as per os and total RNA was extracted after 48 h. The expression levels were normalized against the two tsetse reference genes β-tubulin (GMOY000148) and pleiotrophic regulator 1 (GMOY006161). Expression in each abdomen is plotted relative to the mean of the injection-control group. Values are represented as the mean with the standard deviation. N = 10 independent replicates per group. *p-value < 0.05, ∗∗p-value < 0.01, ∗∗∗p-value < 0.001; Dif, dorsal-related immunity factor; GNBP1, gram-negative binding protein 1; iap2, inhibitor of apoptosis 2; ns, not significant; PGRP, peptidoglycan recognition protein; SOCS, suppressor of cytokine signaling.

