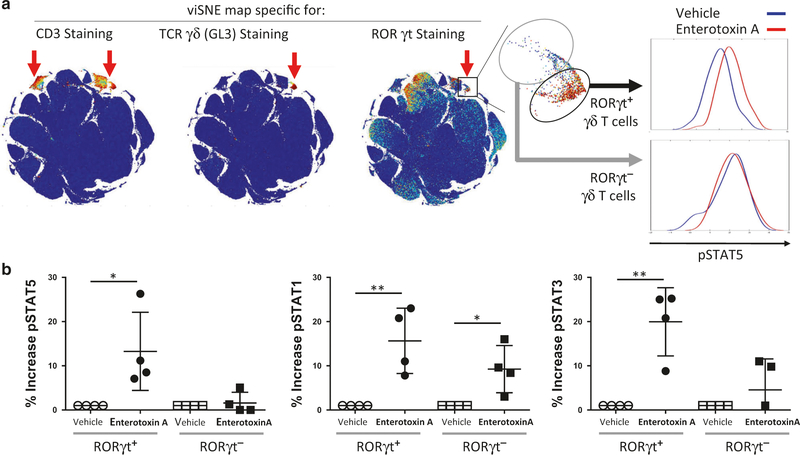
Fig. 2.
RoRγt-expressing γδ T cells phosphorylate STAT5. a Lung cells isolated 4 h post i.n. immunization with S. aureus enterotoxin A or vehicle were barcoded, pooled, and stained with metal-labeled antibodies and analyzed by mass cytometry (Helios). ViSNE maps were used to identify γδ T-cell population (CD3+ GL3+), and RoRγt-expressing cells. Representative histograms of cells expressing pSTAT5 from the gated population are shown for 1 of 4 independent biological replicates. b Quantification of the increase of pSTAT5, pSTAT1, and pSTAT3 in RoRγt+, and RoRγt− γδ T-cell populations is shown for four independent experiments, with one S. aureus enterotoxin A-treated and one vehicle-treated mouse per experiment. Statistical significance was evaluated by one-way ANOVA followed by Dunnet’s test comparing each group to the untreated group

