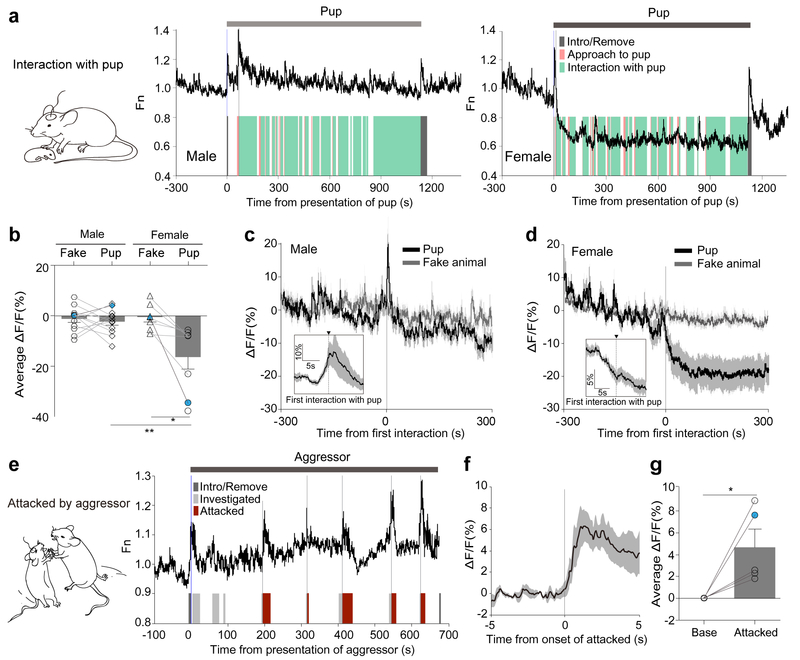
Figure 3. PVN CRF neuronal responses during social interaction.
(a) Schematic for ‘interaction with pup’ and representative traces illustrating PVN-CRFGCaMP6 signal in a male (left) or a female (right) during the presence of a pup. Shaded bars depict the epochs during which the recorded mouse approached to a pup (orange) and interacted with the pup (green), and during which the pup was introduced or removed from the arena (grey). (b) Bar graph summarizing average ΔF/F of PVN-CRFGCaMP6 during the presence of a pup or a fake animal. (N=12 male; N=7–8 female) The measurements shown in blue dots are illustrated in the representative traces in (a). (c-d) PETH plot across male mice (N=12) (c) and across female mice (N=8) (d) aligned to the onset of first interaction with pups. Insets: plot across animals aligned to the onset of first interaction with pup in a 10-s time window. (e) Schematic for ‘attacked by aggressor’ and a representative trace illustrating acute surge in PVN-CRFGCaMP6 signal to the onsets of being investigated (light grey) or being attacked (red) by the male aggressor, and being introduced or removed from the arena (grey). (f) PETH plot across animals aligned to the onset of attacked by male mice (N=5). (g) Bar graph summarizing average ΔF/F of PVN-CRFGCaMP6 during attack. The measurement shown in a red dot is illustrated in the representative traces in (e). Mann-Whitney two-tailed U test in (b) (male vs female); Wilcoxon two-tailed matched singed rank test in (b) (fake vs pup in female); Paired two-tailed t-test in (g) (base vs attacked) were used. *p<0.05, **p<0.01. Data are presented as mean ± s.e.m.

