Fig. 1.
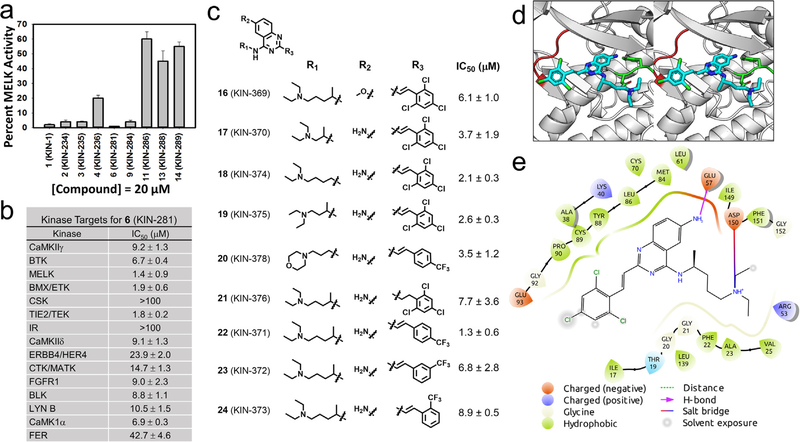
Small molecules inhibit MELK kinase. (a) Derivatives of 1 (KIN-1) were tested for inhibition of MELK activity at 20 μM; data shown as mean ± SD. (b) Compound 6 (KIN-281) was tested for its inhibition of 25 kinases that were selected from a previous kinome profiling. IC50s were obtained for each kinase; data shown as mean ± SD. (c) Chemical structure of derivatives of 6 (KIN-281) that were synthesized along with IC50 for inhibition of MELK activity. (d) The binding mode of 6 (KIN-281, shown as cyan stick) to MELK (PDB: 4cqg, shown as gray cartoon). MELK is shown in cartoon, with the side chain of key residues shown in stick. The hinge loop and DFG motif of MELK are colored in red and green, respectively. The glycine-rich loop from Glu15 to Leu27 is removed to visualize the ATP binding site. In the model, the primary amine on the quinazoline core of the compound forms a hydrogen bond with Glu57 on the αC helix of the MELK (shown as dotted orange line). The N-alkylamine tail of the compound is stabilized by a salt bridge to Asp150 in the DFG motif of the kinase (shown as dotted green line). (e) A 2D view of the binding mode of (S)-6 to MELK. Residues are shown as droplets, with the orientation of the droplet indicating the direction of the side chain of the given residue. The hydrogen bond between Glu57 and the quinazoline core is shown in magenta. The salt bridge between the N-alkylamine tail of the compound and Asp150 is shown as a line colored as a gradient from orange to blue. The ligand interaction diagram is generated using Schrödinger Maestro and a cutoff of 4 Å.

