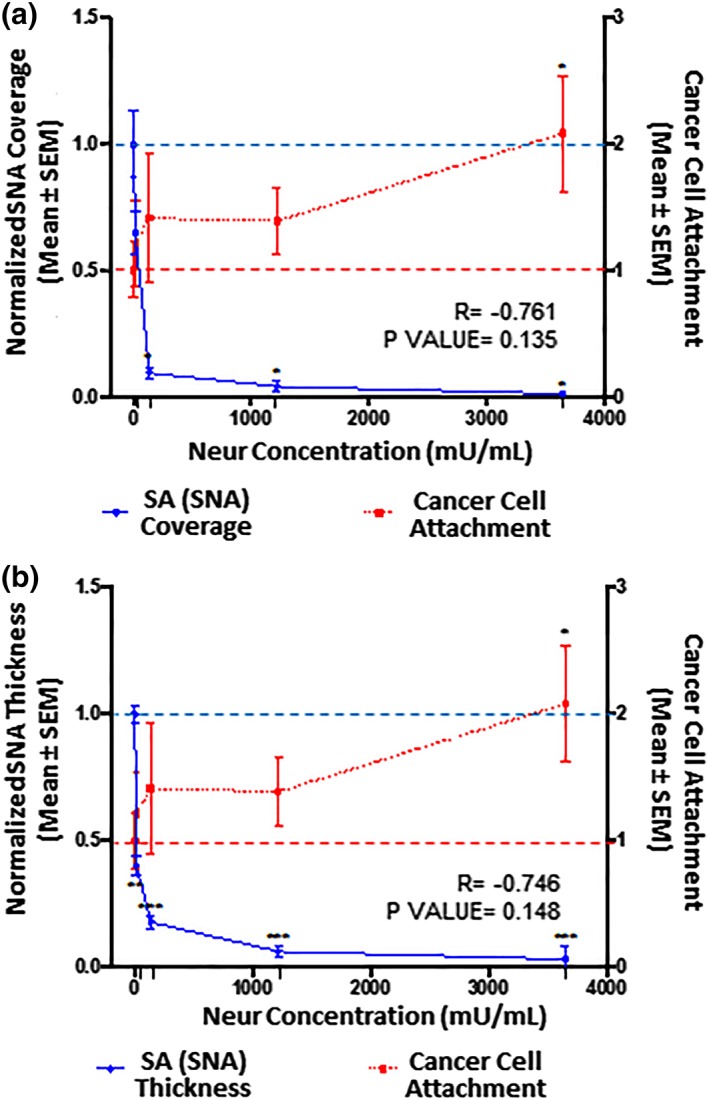
Figure 5.

The extent of EC coverage by SA and the thickness of SA, as assessed by quantifying SNA‐labeled ∝‐2,6‐linked SA residue, are compared to the number of cancer cells that attach to endothelium. 0 mU/mL baseline conditions are indicated by the dashed lines (‐ ‐ ‐). Significance is denoted as *p < .05, **p < .01, and ***p < .001. (a) Compared to 0 mU/mL Neur conditions, SNA‐labeled ∝‐2,6‐linked SA residue coverage of ECs becomes statistically low at Neur doses of 135, 1,215, and 3,645 mU/mL. N = 3, and representative en face images are shown in Figure 2k–o. (b) Compared to 0 mU/mL Neur conditions, SNA‐labeled ∝‐2,6‐linked SA residue thickness is statistically significantly affected by Neur doses of 15, 135, 1,215, and 3,645 mU/mL. N = 3, and representative cross‐section images used for this data are shown in Figure 2k–o. (a, b) The observed Neur‐induced increase in cancer attachment as shown in Figure 3 is shown again, for comparison to expression of SNA‐labeled ∝‐2,6‐linked SA residue. At 0 mU/mL, N = 9; at 15 mU/mL, N = 8; at 135 mU/mL, N = 8; at 1,215 mU/mL, N = 9; and at 3,645 mU/mL, N = 9, and representative images used for this data are shown in Figure 2u–y. EC, endothelial cell; SA, sialic acid; SNA, Sambucus nigra (elderberry bark) lectin
