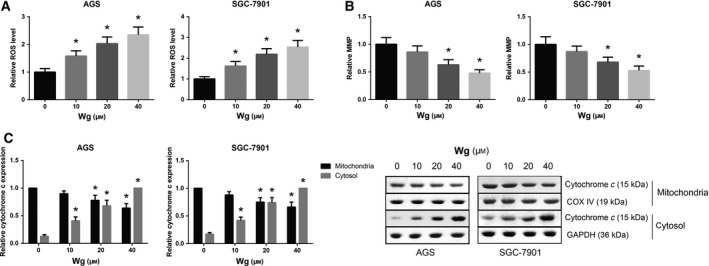
Figure 4.

Wg induces ROS accumulation and mitochondrial dysfunction in GC cells. (A) Increased ROS accumulation of Wg‐treated AGS and SGC‐7901 cells, measured by flow cytometric analysis. (B) Impaired MMP of Wg‐treated AGS and SGC‐7901 cells, measured by flow cytometric analysis. (C) Western blot analysis of mitochondrial and cytoplasmic cytochrome c expression levels in Wg‐treated AGS and SGC‐7901 cells. Data are expressed as mean ± SD from three independent experiments. Differences between groups were analyzed using ANOVA test followed by Tukey's post hoc test. *P < 0.05 versus DMSO‐treated cells.
